Current Data
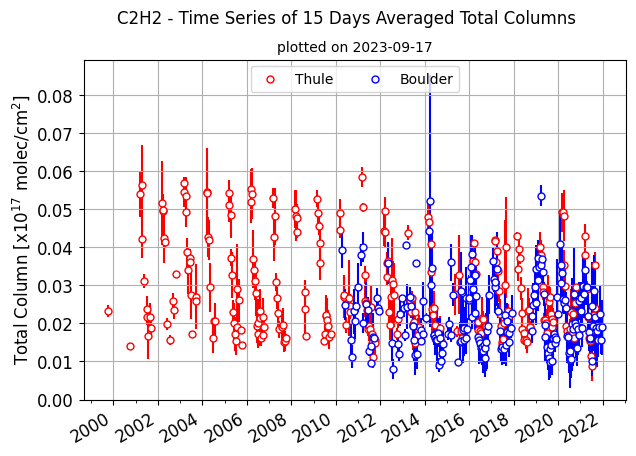
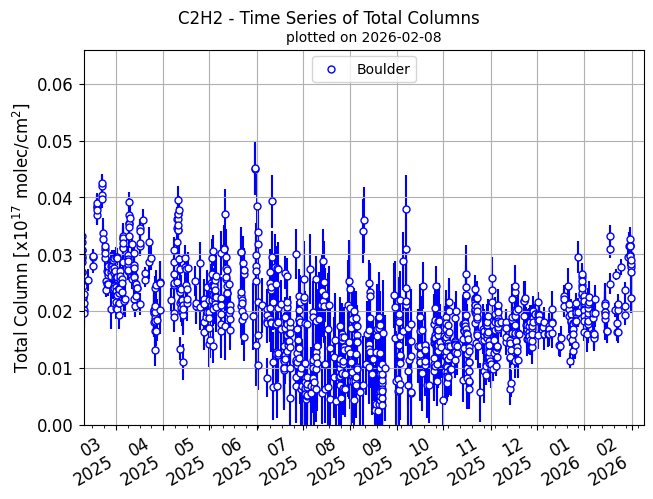
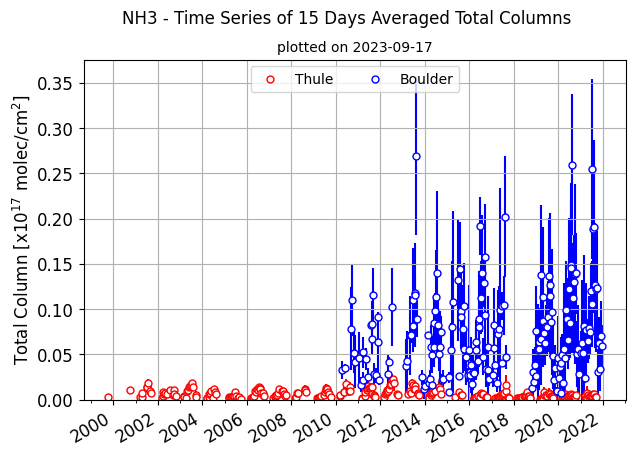
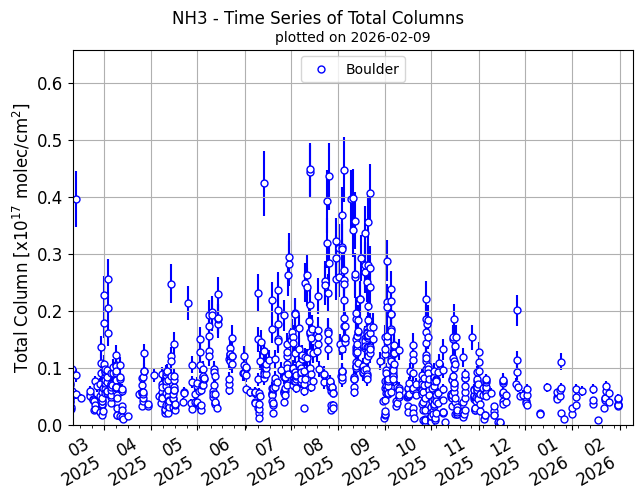
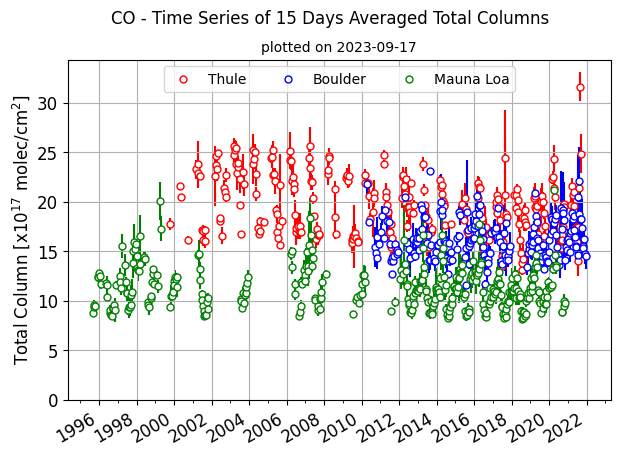
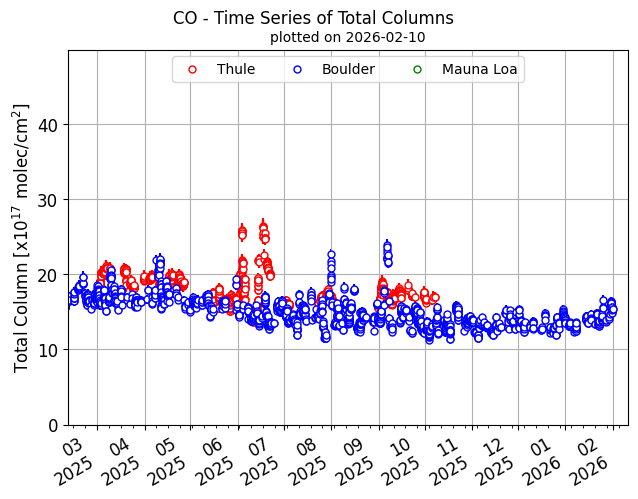
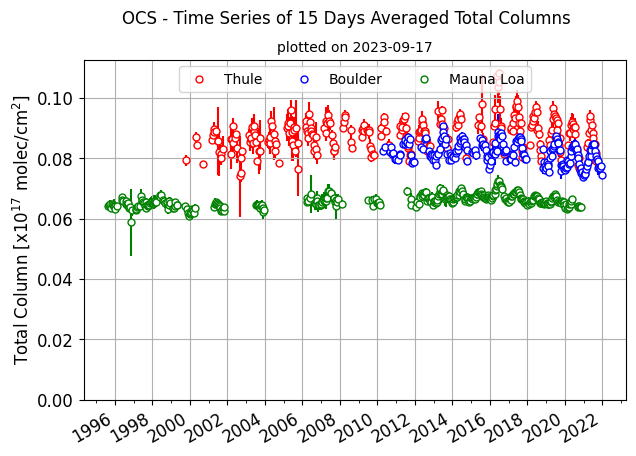
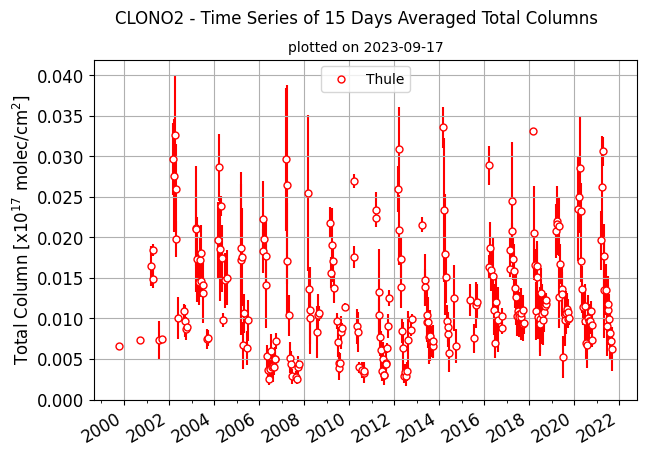
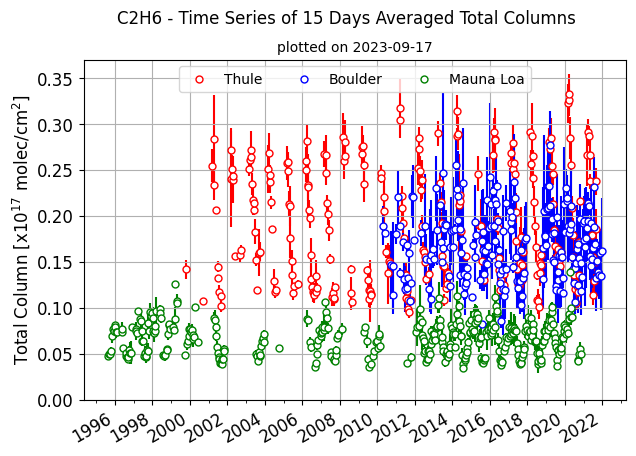
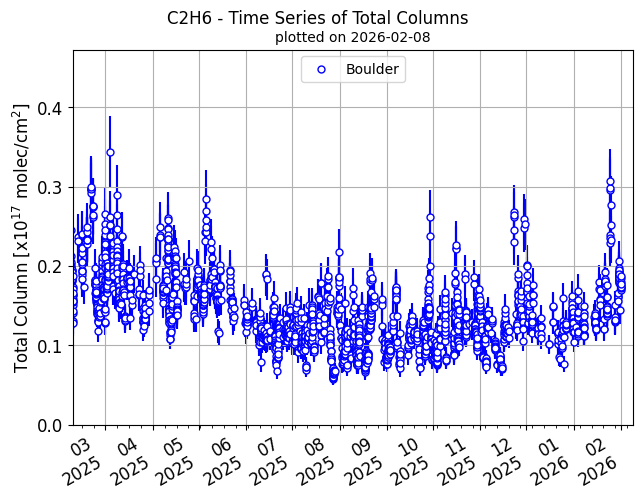
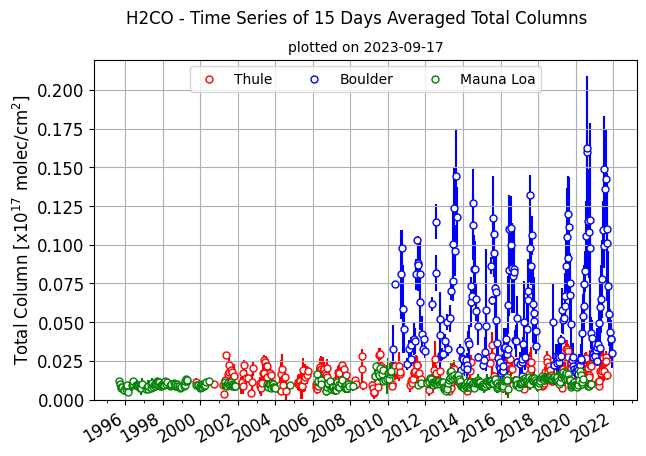
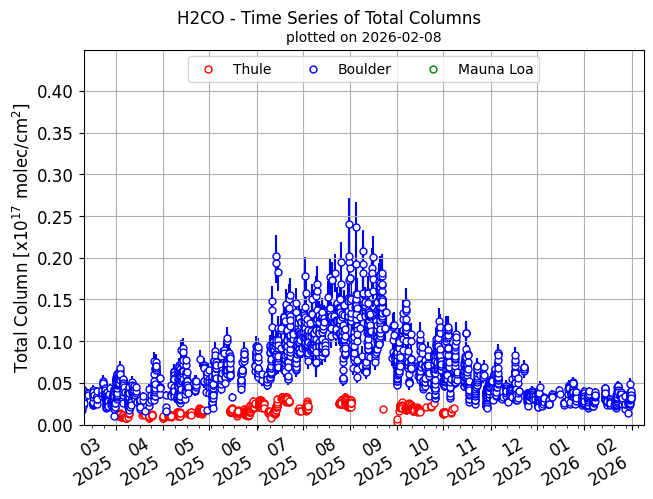
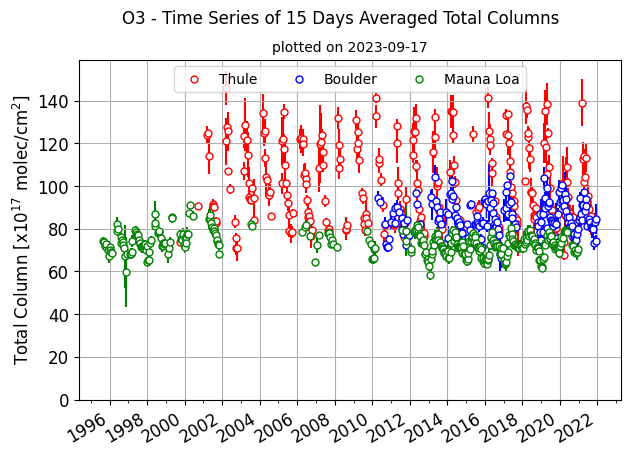
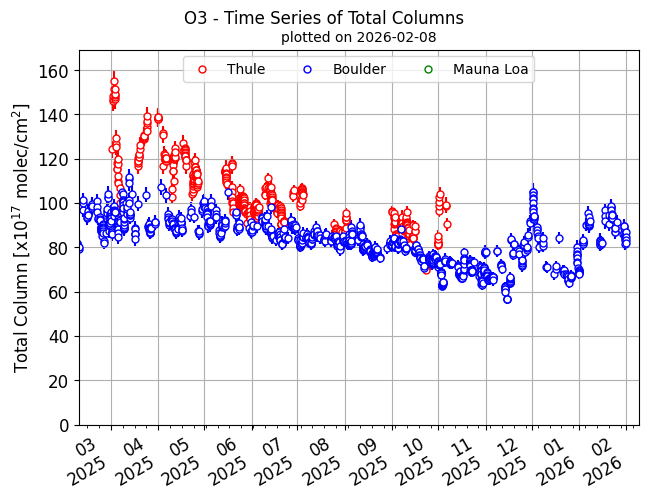
Quick plots of total column data for a number of species of interest, from the Optical Technique’s three NDACC stations at Thule Greenland (76ºN, red), Mauna Loa, HI (20ºN green) and Boulder, CO (40ºN, blue). The left column are the long term time series from inception and shown as the 15-day average of the total column, where the vertical bar is 1 standard deviation of the average. These plots are updated semi-annually. The right column are data processed every 15 days as part of our ‘rapid delivery’ (RD) data product. These are individual total columns (1 to several per day) where the vertical bar is the uncertainty in the retrieval. These are plotted from 12 months prior to present.
The long term and some RD data are available at the NDACC Data Handling Facility and at the UCAR DASH repository. See also the DASH Archive Listing for the data available.
Contact us for more information.
Acetylene (C2H2)
Click for larger image.
Click for larger image.
Ammonia (NH3)
Click for larger image.
Click for larger image.
Carbon monoxide (CO)
Click for larger image.
Click for larger image.
Carbonyl sulfide (OCS)
Click for larger image.
Chlorine nitrate (CLONO2)
Click for larger image.
Ethane (C2H6)
Click for larger image.
Click for larger image.
Formaldehyde (H2CO)
Click for larger image.
Click for larger image.
Hydrochloric acid (HCL)
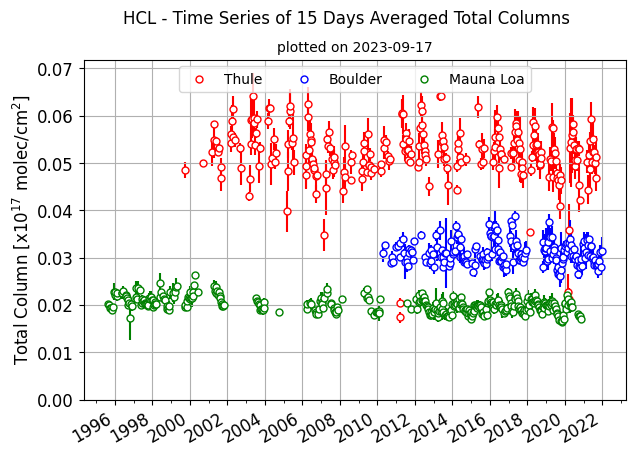
Click for larger image.
Hydrogen cyanide (HCN)
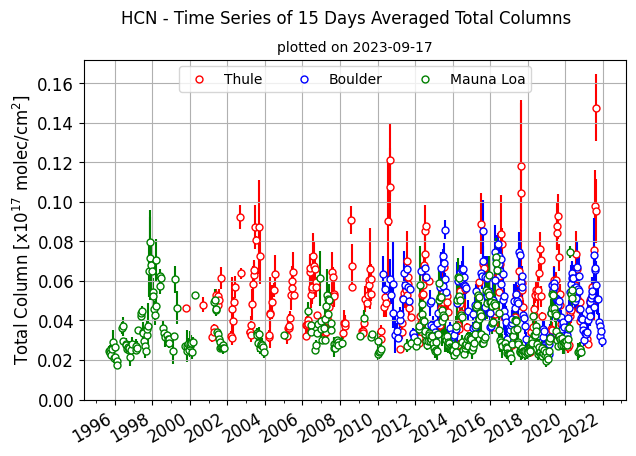
Click for larger image.
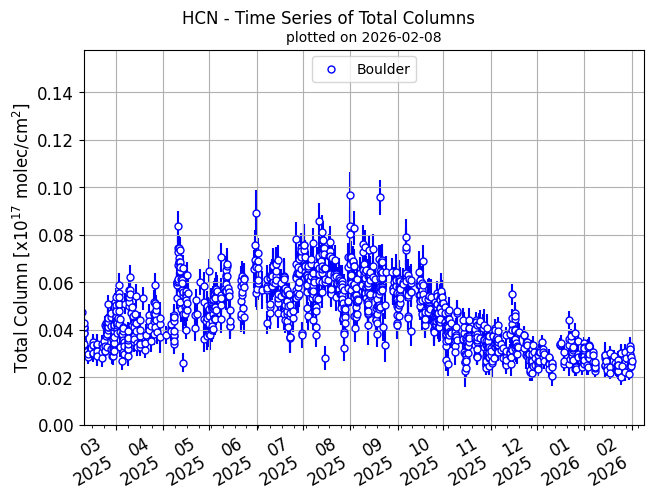
Click for larger image.
Hydrogen fluoride (HF)
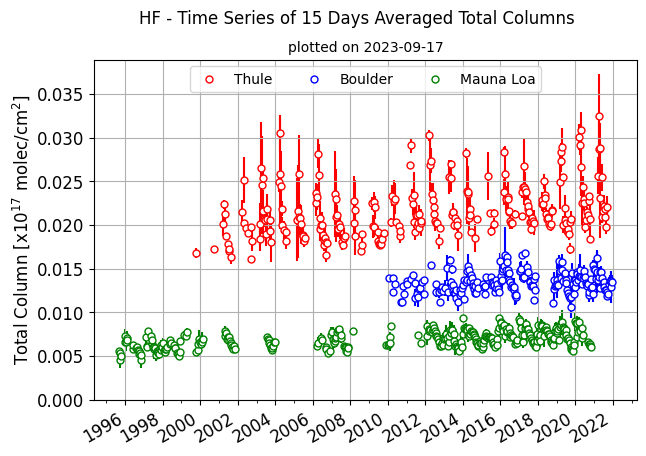
Click for larger image.
Methane (CH4)
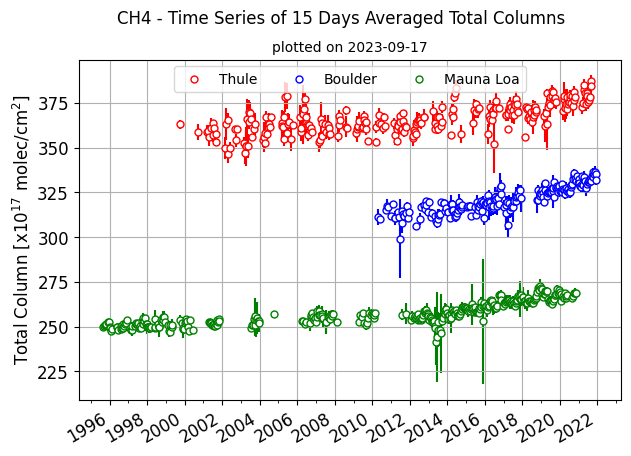
Click for larger image.
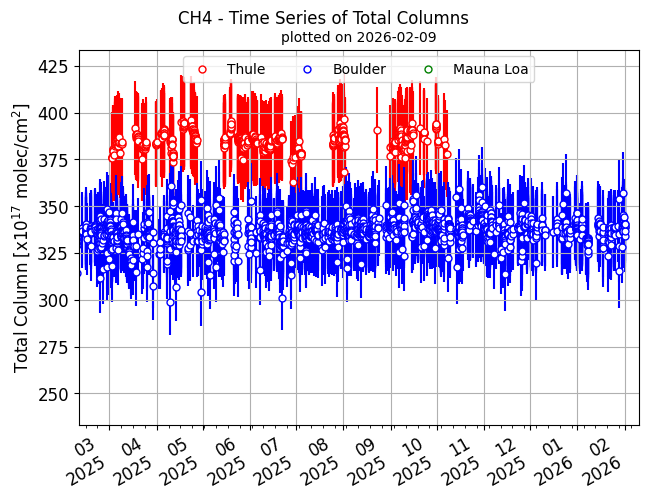
Click for larger image.
Nitric acid (HNO3)
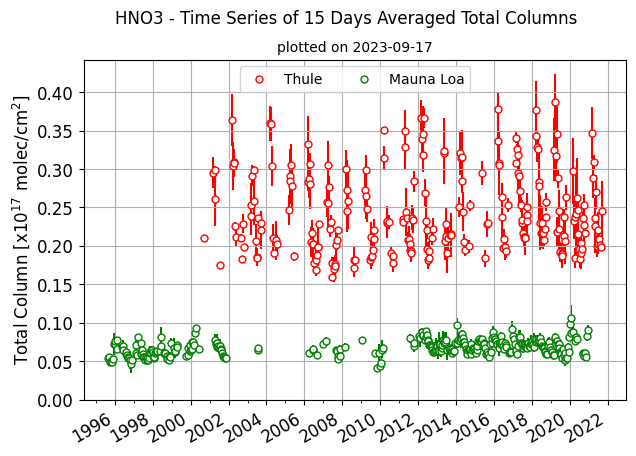
Click for larger image.
Nitrous oxide (N2O)
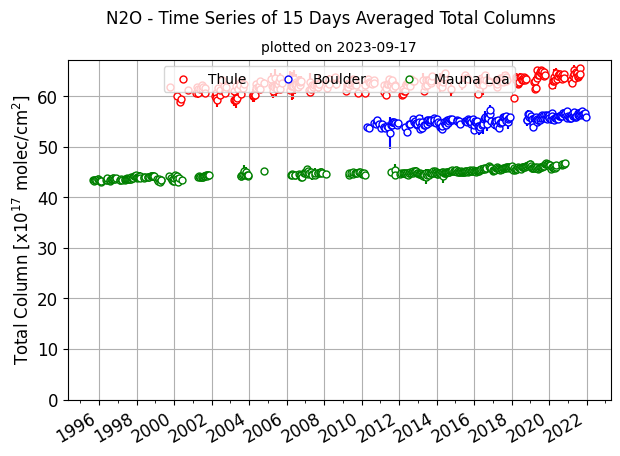
Click for larger image.
Ozone (O3)
Click for larger image.
Click for larger image.
Contact
Please direct questions/comments about this page to: