Science Highlights
Convective Transport of Soluble Trace Gases and Aerosols
WRF-Chem Simulations of Thunderstorms and Chemistry
The ability of WRF-Chem to represent wet scavenging of trace gases is being evaluated using observations from the Deep Convective Clouds and Chemistry (DC3) Field Campaign. The 29 May 2012 severe storm in northern Oklahoma is simulated with WRF-Chem using a grid spacing of 1 km in the horizontal and 90 vertical levels from the surface to 50 hPa. Removal of soluble trace gases, e.g. nitric acid, sulfur dioxide, formaldehyde, hydrogen peroxide, and methyl hydrogen peroxide, is parameterized using the Neu and Prather (2012) scheme.
|
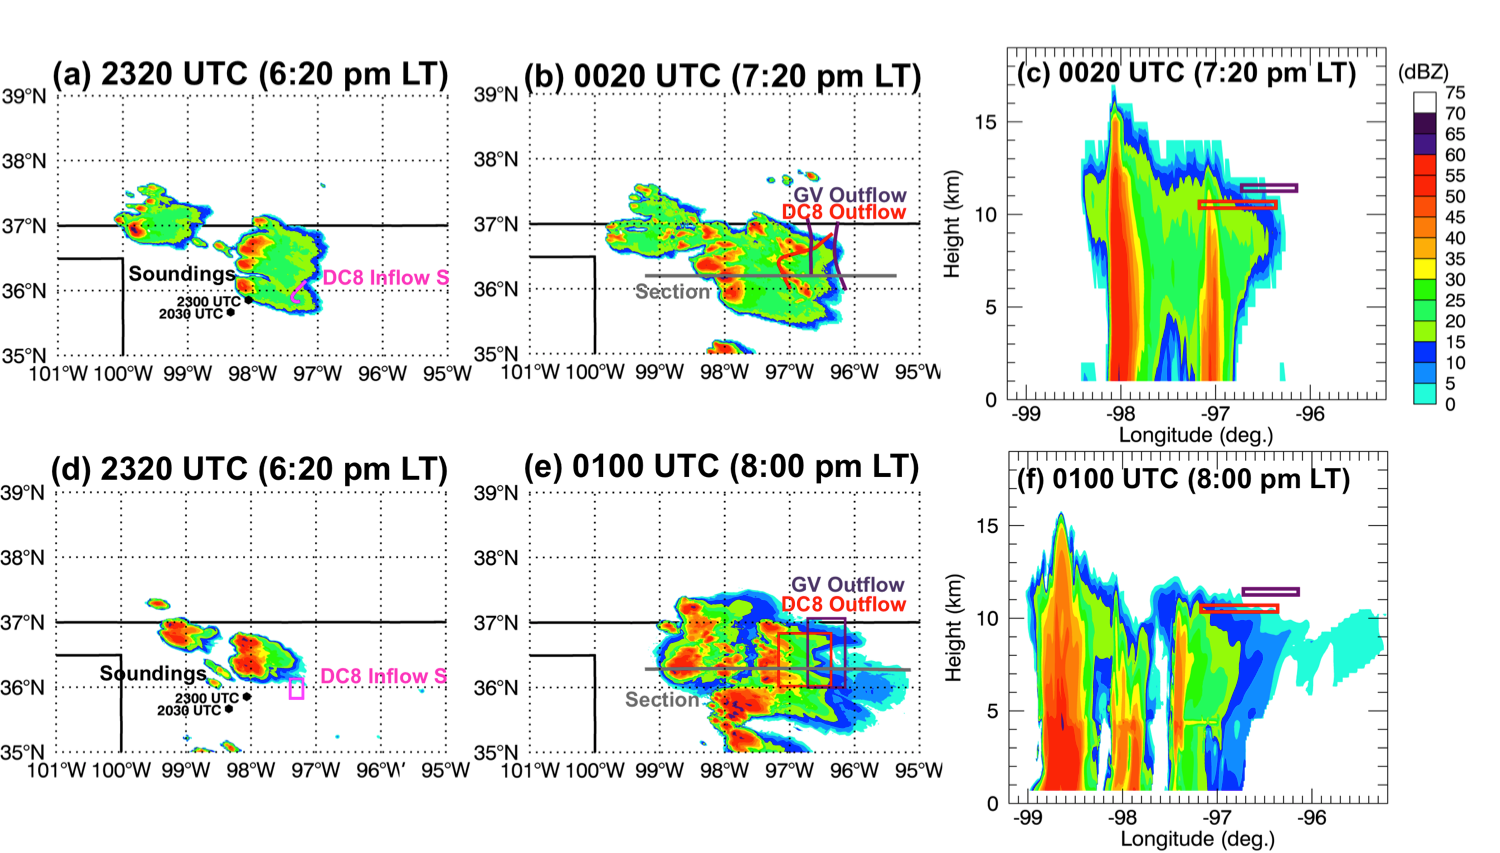
WRF-Chem simulates the storm location, size, and structure of the 29 May storm |
Column-maximum radar reflectivity (dBZ) and east-west vertical cross-section of reflectivity from NEXRAD observations (upper panels) and WRF-Chem (lower panels). Regions where the aircraft sampled the composition of the inflow air (magenta) and outflow air (red and black) are marked.
|
|
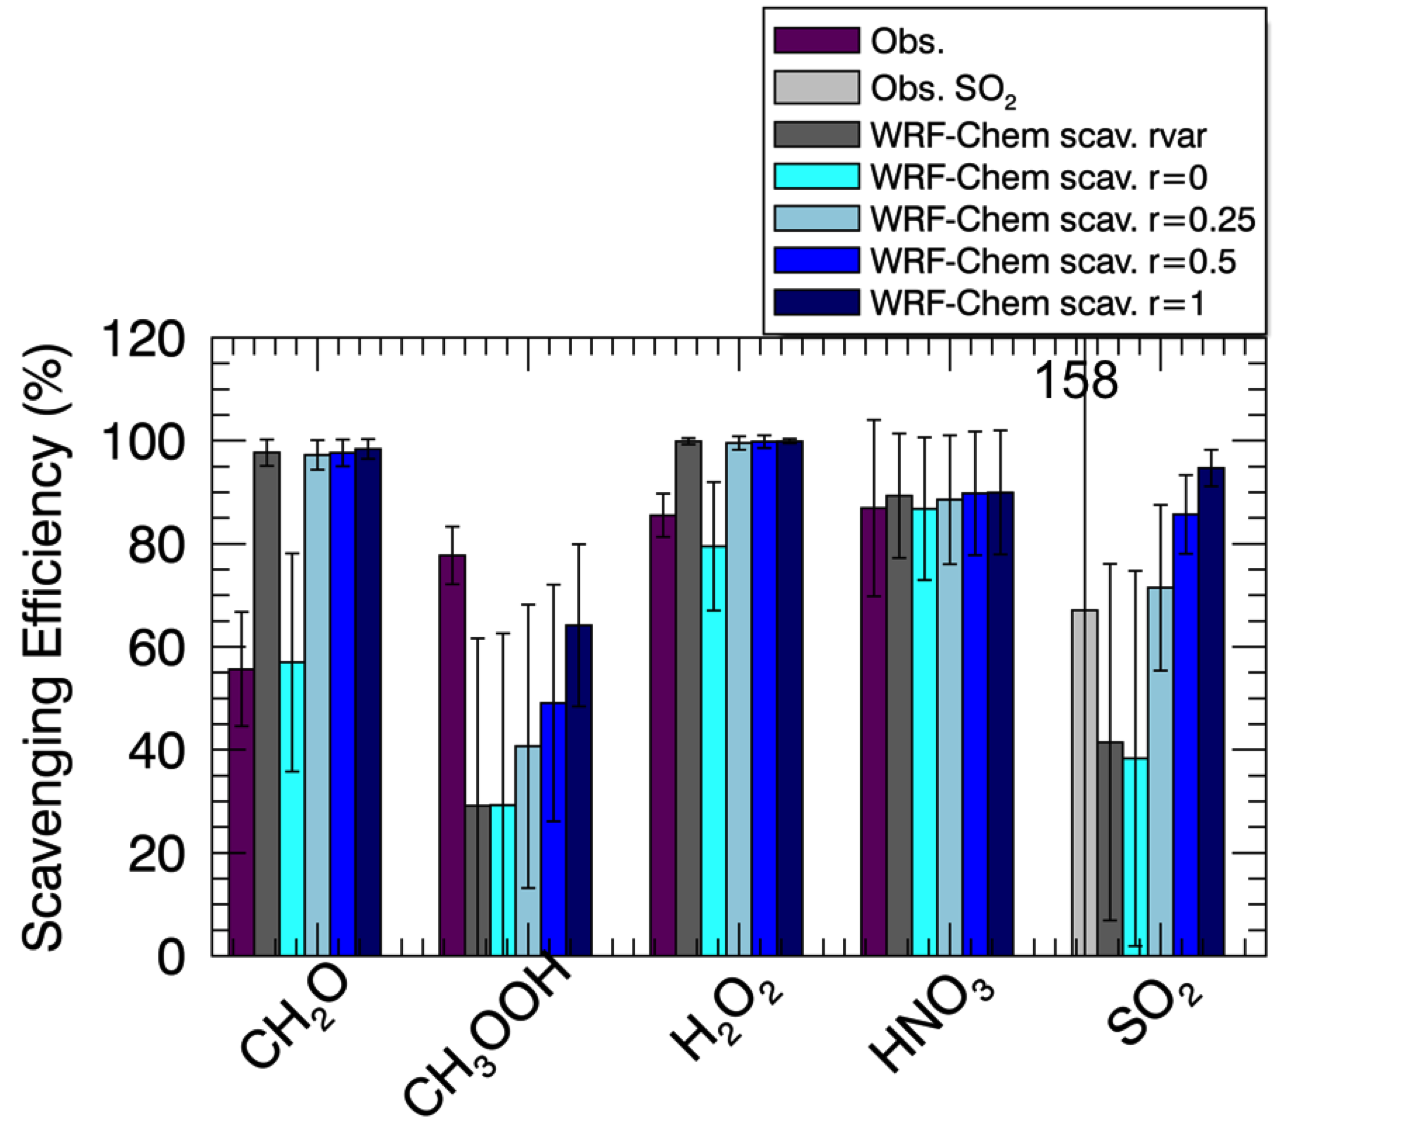
Scavenging efficiencies of soluble species for the Oklahoma May 29-30 storm as derived from observations in the inflow and outflow regions of the storm and from the ve WRF-Chem simulations with scavenging. The fraction r of trace gas retained in freezing cloud and rain water is varied in different simulations showing the sensitivity of the trace gas to this process. |
The simulated scavenging efficiencies are sensitive to how much of the trace gas is retained in a frozen cloud particle (when cloud drops freeze).
|
Bela, M. M., M. C. Barth, O. B. Toon, A. Fried, C. R. Homeyer, H. Morrison, K. A. Cummings, Y. Li, K. E. Pickering, D. Allen, Q. Yang, P. O. Wennberg, J. D. Crounse, J. M. St. Clair, A. P. Teng, D. O’Sullivan, L. G. Huey, D. Chen, X. Liu, D. Blake, N. Blake, E. Apel, R. S. Hornbrock, F. Flocke, T. Campos, G. Diskin, 2016: Wet Scavenging of Soluble Gases in DC3 Deep Convective Storms Using WRF-Chem Simulations and Aircraft Observations. J. Geophys. Res., 121, doi:10.1002/2015JD024623.
Lightning
Lightning Production of NOx
Mixing between Upper Troposphere and Lower Stratosphere
Thunderstorms Enhance Tropospheric Ozone by Wrapping and Shedding Stratospheric Air
Recent observations during the Deep Convective Cloud and Chemistry (DC3) campaign provided the first unambiguous evidence that the tropopause reaching thunderstorms bring ozone-rich stratospheric air down to the troposphere.
|
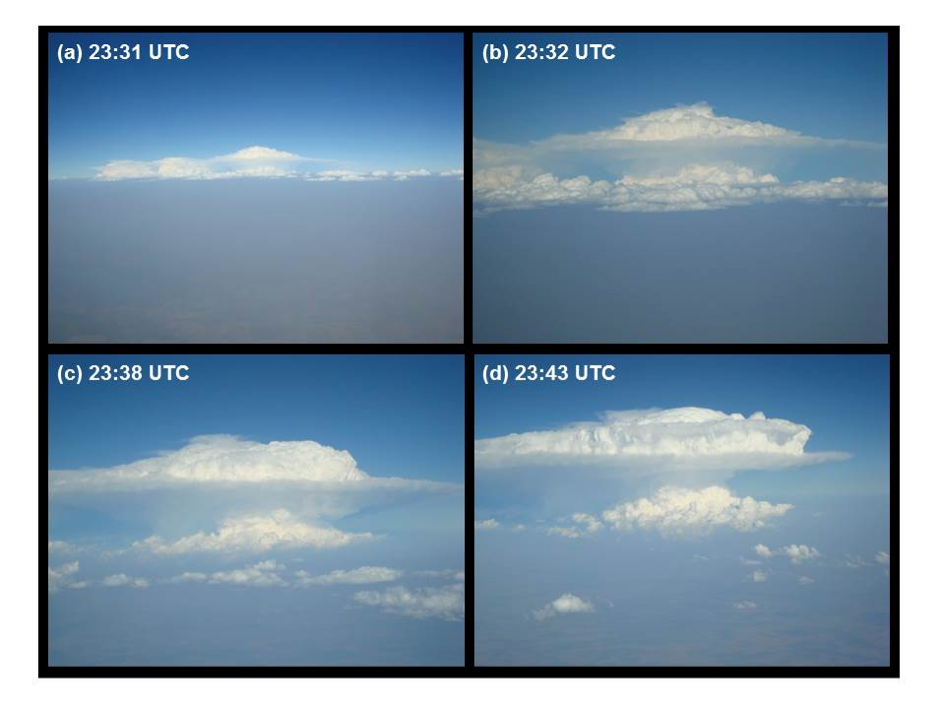
Thunderstorms with overshooting tops were often observed during DC3
|
|
| Figure: Falcon flight on May 29, 2012: View from the cockpit at 23:31 UTC (a), 23:32 UTC (b), 23:38 UTC (c), and 23:43 UTC (d). Along the border between Texas and Oklahoma, in a polluted air mass impacted by the smoke plume from the New Mexico Whitewater-Baldy Fire, a rapidly growing supercell developed with a double-decker outflow (Photo: R. Welser, DLR). |
|
|
|
|
|
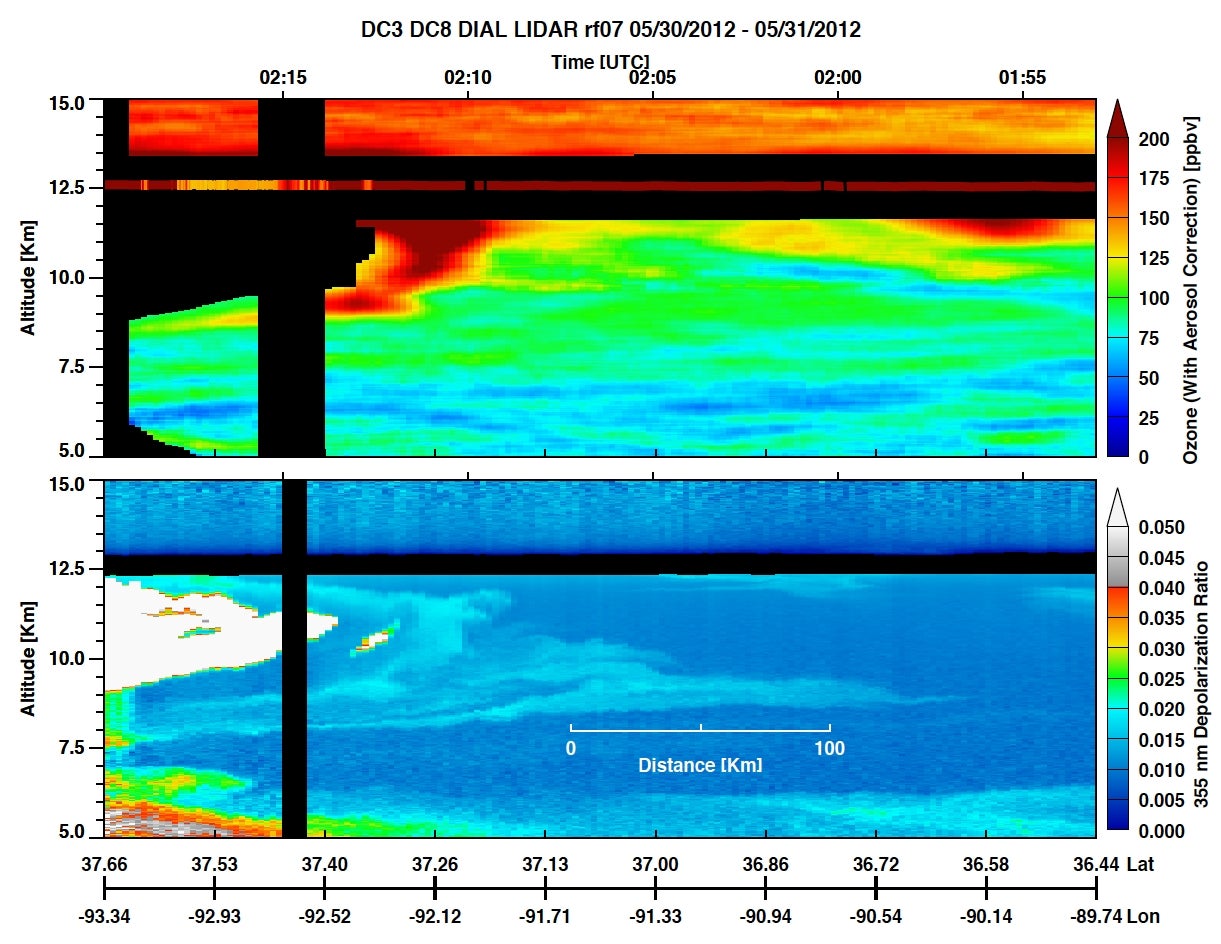
The dial ozone lidar picture measured onboard the NASA DC-8 research aircraft shows the wrapping and shedding of ozone-rich stratospheric air near the cloud edge of a MCS.
|
|
|
|
Figure: The vertical distribution of upper tropospheric ozone mixing ratio (upper panel) measured by DIAL along approximately 30 minutes (~ 400 km in distance) of the DC-8 flight. The black color indicates the region when the DIAL ozone channel produced no data due to cloud attenuation. In situ ozone is shown by the color of the flight track at 12.5 km altitude. The depolarization ratio (lower panel) from the DIAL 355 nm wavelength channel provides a signature of cloud/storm edge and outflow pattern in the neighborhood of the storm. The outflow structure shown in light blue is most consistent with low number density of ice particles, which complements the stretching and shedding shown in the ozone structure (upper panel).
|
| Pan, L. L., C. R. Homeyer, S. B. Honomichl,B. A. Ridley, M. Weisman, M. Barth, J. W. Hair, M. A. Fenn, C. F. Butler, G. S. Diskin, J. H. Crawford, T. B. Ryerson, I. B. Pollack, and H. Huntrieser (2014), Thunderstorms Enhance Tropospheric Ozone by Wrapping and Shedding Stratospheric Air, Geophys. Res. Lett. , 41, 7785–7790, doi:10.1002/2014GL061921. | |
|
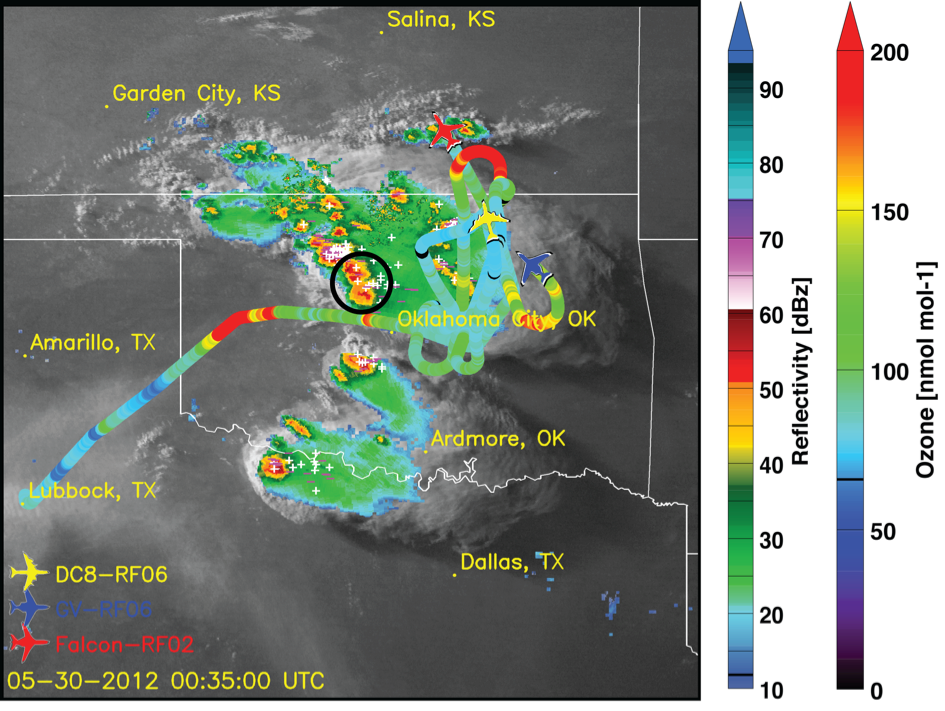
During a joint flight with all DC3 aircraft especially low ozone mixing ratios were measured in vicinity of the convective core (indicating upward transport from the boundary layer) and especially high ozone mixing ratios were observed just outside and along the boundary of the anvil outflow (indicating downward transport of ozone-rich air masses from the stratosphere).
|
|
|
Figure: A joint flight of the Falcon (red aircraft), DC8 (yellow aircraft), and GV (blue aircraft) in the evening on May 29 to probe a line of isolated supercell storms over Oklahoma. The flight tracks (color-coded according to measured O3 mixing ratios) are superimposed on a GOES IR satellite image (grey), NEXRAD radar reflectivity (colored clouds), and NLDN lightning data (white/pink plus/minus sign for positive/negative flashes) from May 30 at 00:35 UTC. The Falcon flight (b-flight) with start from Lubbock is shown. In addition, portions of the DC8 and GV flight tracks for the last hour are superimposed. The smoke plume from the New Mexico Whitewater-Baldy Fire is visible near Lubbock. |
|
The fine-scale transport from the stratosphere may be a significant source of upper troposphere ozone complementing the in situ production of ozone in convective outflow regions. However, this fine-scale transport poses a significant challenge to global models that do not resolve storm scale dynamics, yet it is important to include such a representation because of the effect of ozone in the upper troposphere on the atmospheric radiation budget and on the tropospheric oxidizing capacity.Stratosphere-troposphere exchange by thunderstorms is especially pronounced over the Central U.S. as indicated in global climatologies of stratospheric water vapor satellite data.
|
|
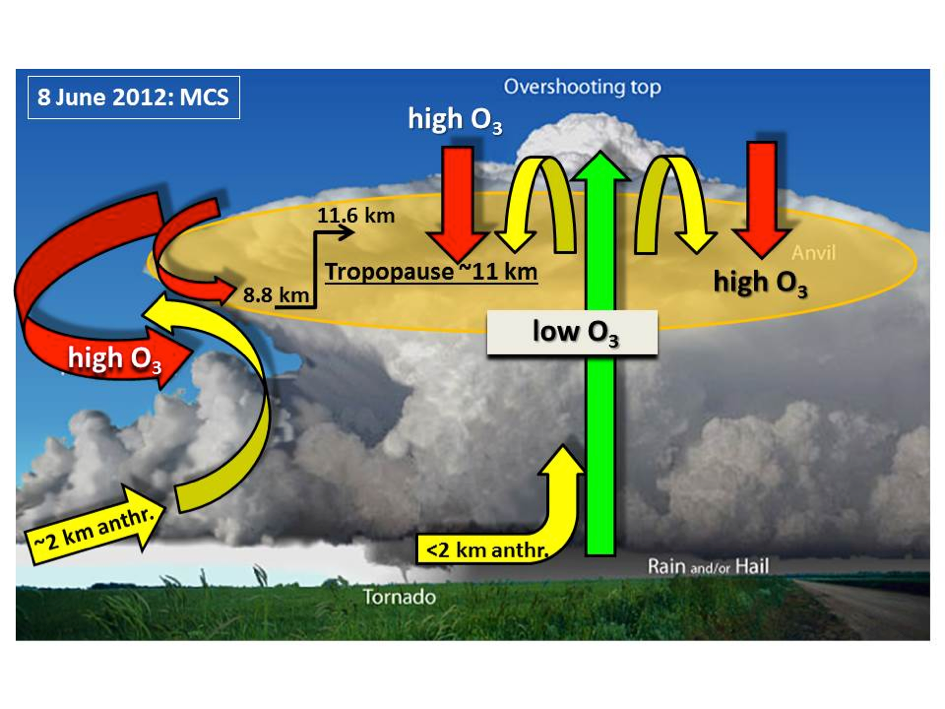
Figure: Schematic of an isolated, overshooting thunderstorm cell (credit: NOAA National Weather Service, http://www.srh.noaa.gov/jetstream/tstorms/tstrmtypes.htm). Superimposed are the major air mass transport pathways (colored arrows) observed during the Falcon flight on June 8, 2012 based on in-situ trace gas measurements (CO and O3) within the main vertical and horizontal extension of the anvil outflow from a MCS (orange shaded area). Anthropogenic emissions and low O3 mixing ratios are ingested into the overshooting MCS (yellow and green). Strong up- and downdrafts within the storm redistribute the ingested pollution. As a response to the overshooting top, stratospheric air masses are transported downwards into the anvil outflow (red). In addition, anthropogenic emissions (yellow) are ingested into towering cumulus along the flanking line of the overshooting MCS and mix with a stratospheric intrusion wrapped around the anvil outflow (red). |
| Huntrieser, H., M. Lichtenstern, M. Scheibe, H. Aufmhoff, H. Schlager, T. Pucik, A. Minikin, B. Weinzierl, K. Heimerl, I. B. Pollack, J. Peischl, T. B. Ryerson, A. J. Weinheimer, S. Honomichl, B. A. Ridley, M. I. Biggerstaff, D. P. Betten, J. W. Hair, C. F. Butler, M. J.. Schwartz, M. C. Barth, 2016: Injection of lightning-produced NOx, water vapor, wildfire emissions, and stratospheric air to the UT/LS as observed from DC3 measurements. J. Geophys. Res. Atmos., 121, doi:10.1002/2015JD024273. | |