SEAC4RS: Campaign Planning
Anticyclone Location by GPH (NCEP/GFS data)
| Flow | Anticyclone | |||||
|---|---|---|---|---|---|---|
| 2009: | 500 hPa | 300 hPa | 200 hPa | 150 hPa | 100 hPa | Stacked |
| 2010: | 500 hPa | 300 hPa | 200 hPa | 150 hPa | 100 hPa | Stacked |
| 2011: | 500 hPa | 300 hPa | 200 hPa | 150 hPa | 100 hPa | Stacked |
CO fields from WACCM-SD and MOZART4
| Curtains | Planview 850 & 200 hPa | Planview 150 & 100 hPa | ||||
|---|---|---|---|---|---|---|
| 2007: | MOZART-4 | MOZART-4 | MOZART-4 | |||
| 2008: | MOZART-4 | MOZART-4 | MOZART-4 | |||
| 2009: | WACCM | MOZART-4 | WACCM | MOZART-4 | WACCM | MOZART-4 |
| 2010: | WACCM | MOZART-4 | WACCM | MOZART-4 | WACCM | MOZART-4 |
| 2011: | WACCM | WACCM | WACCM | |||
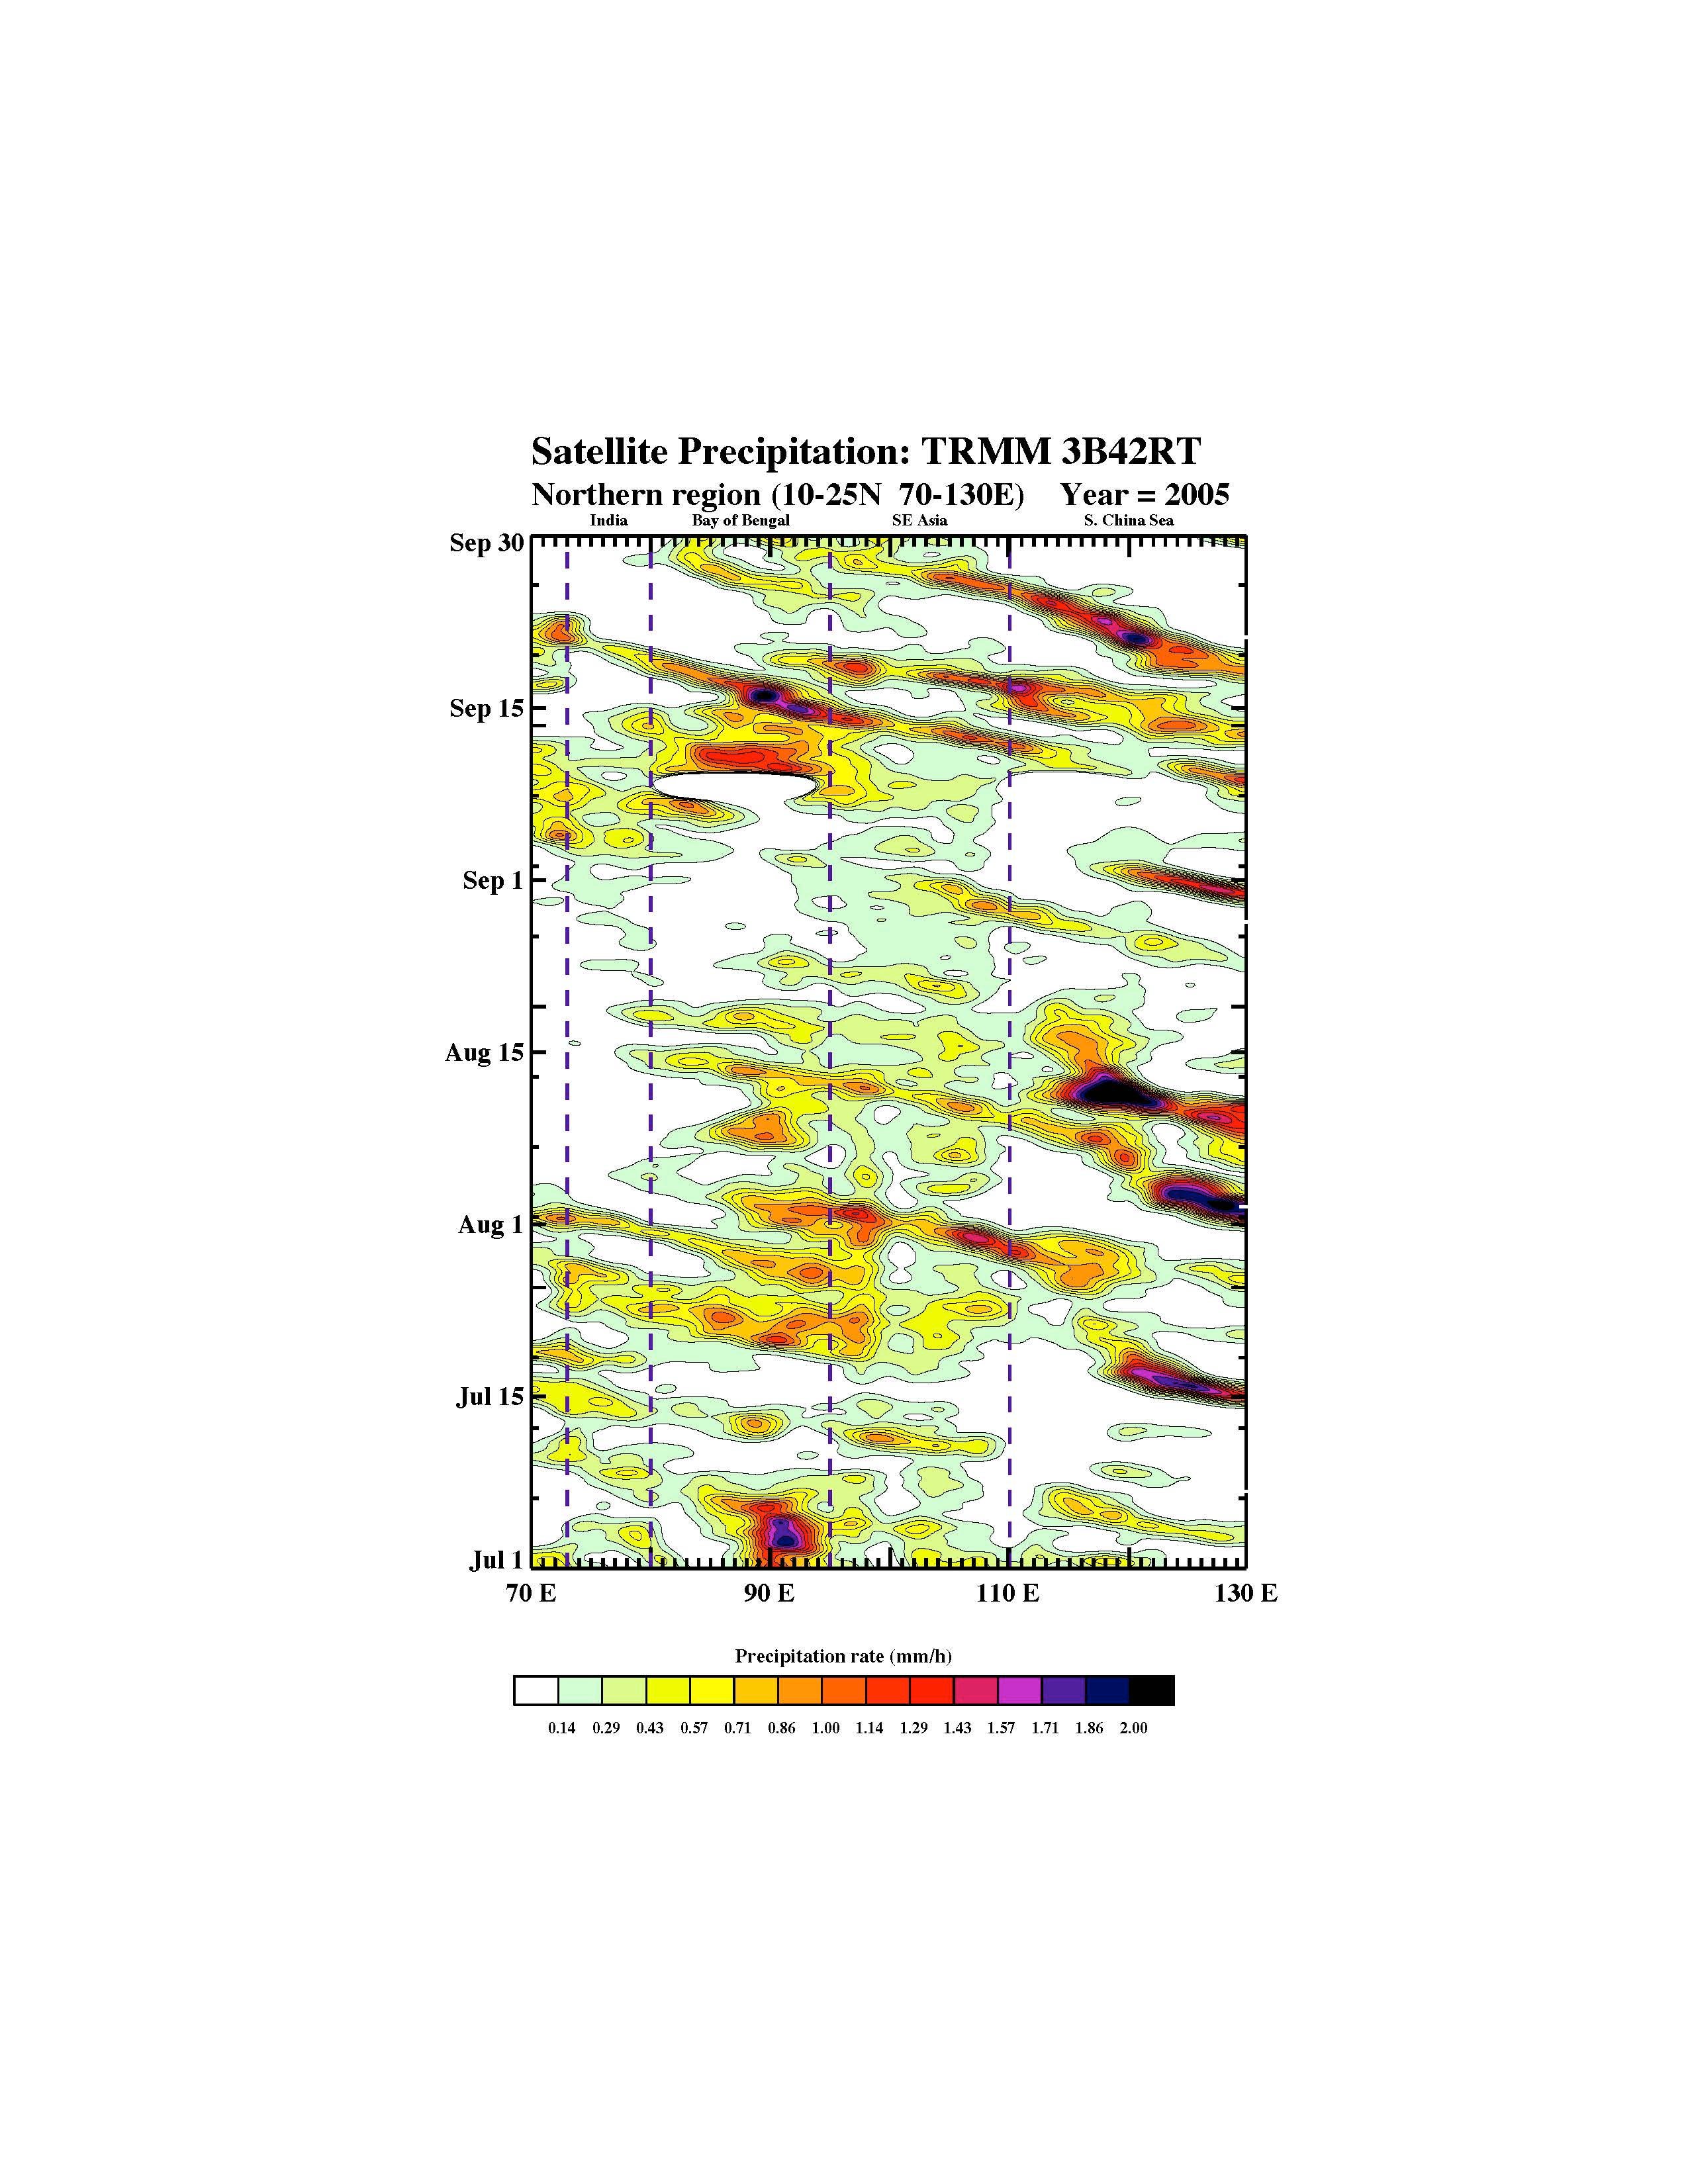
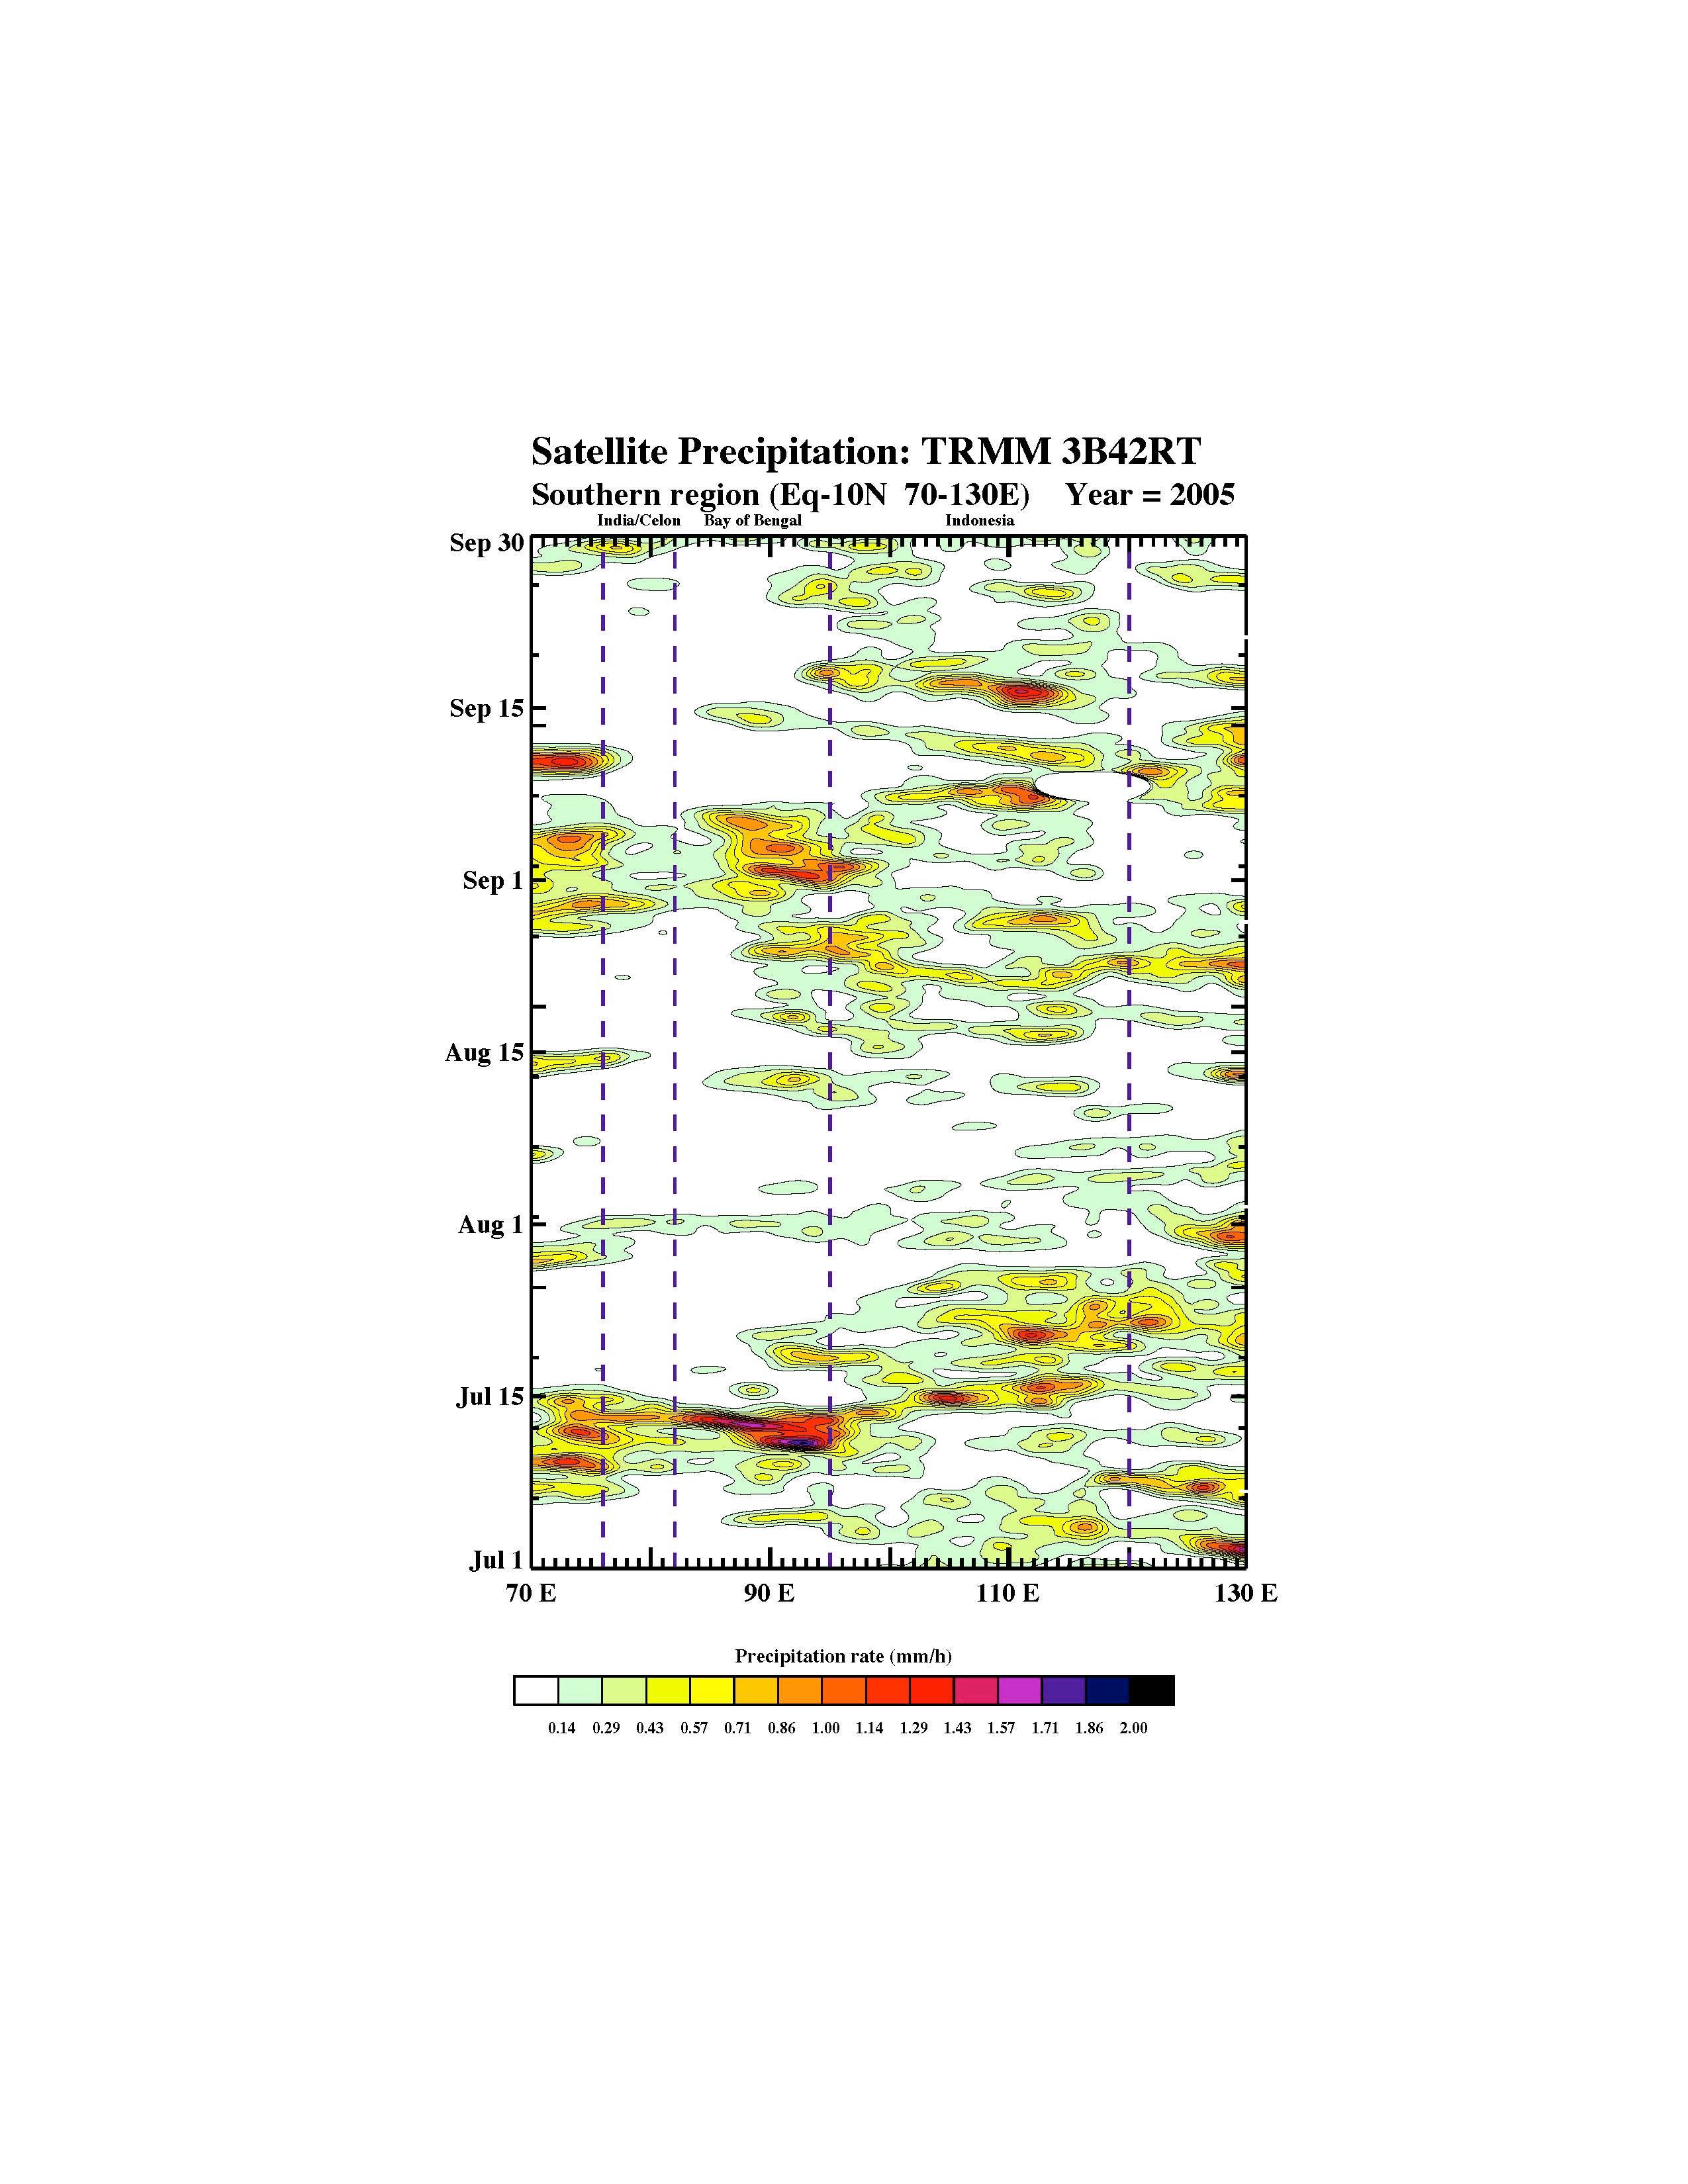
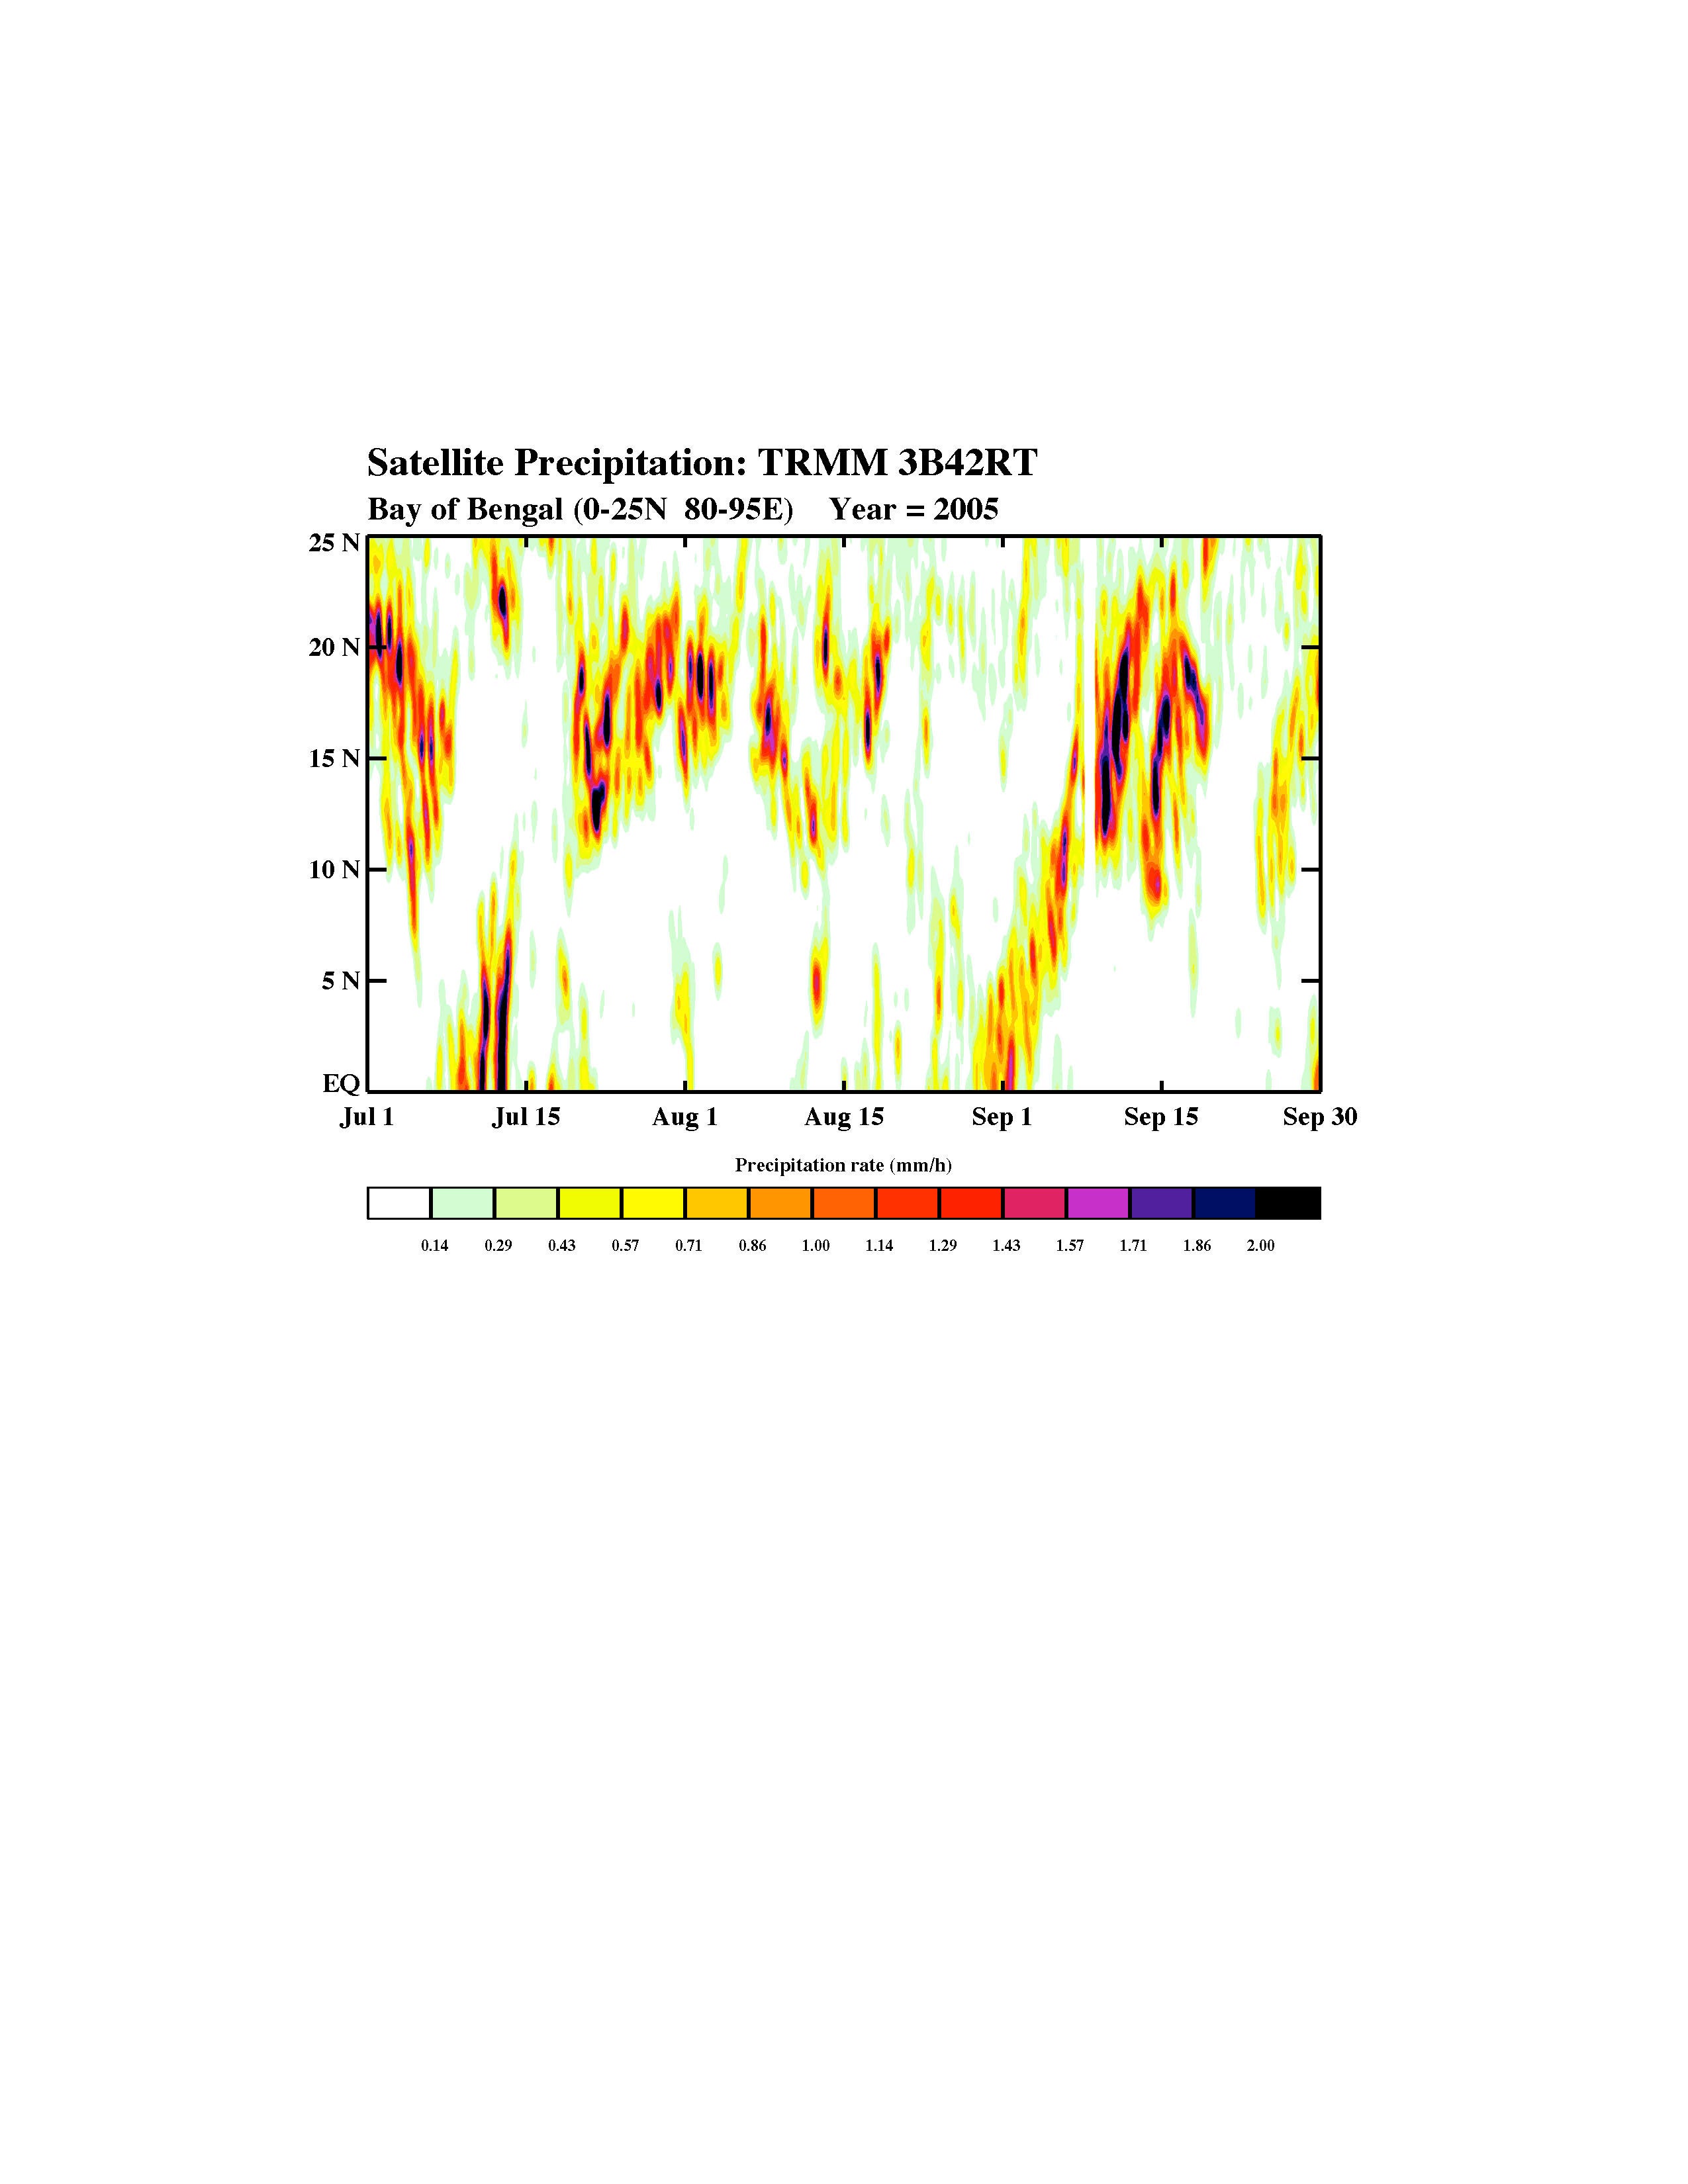
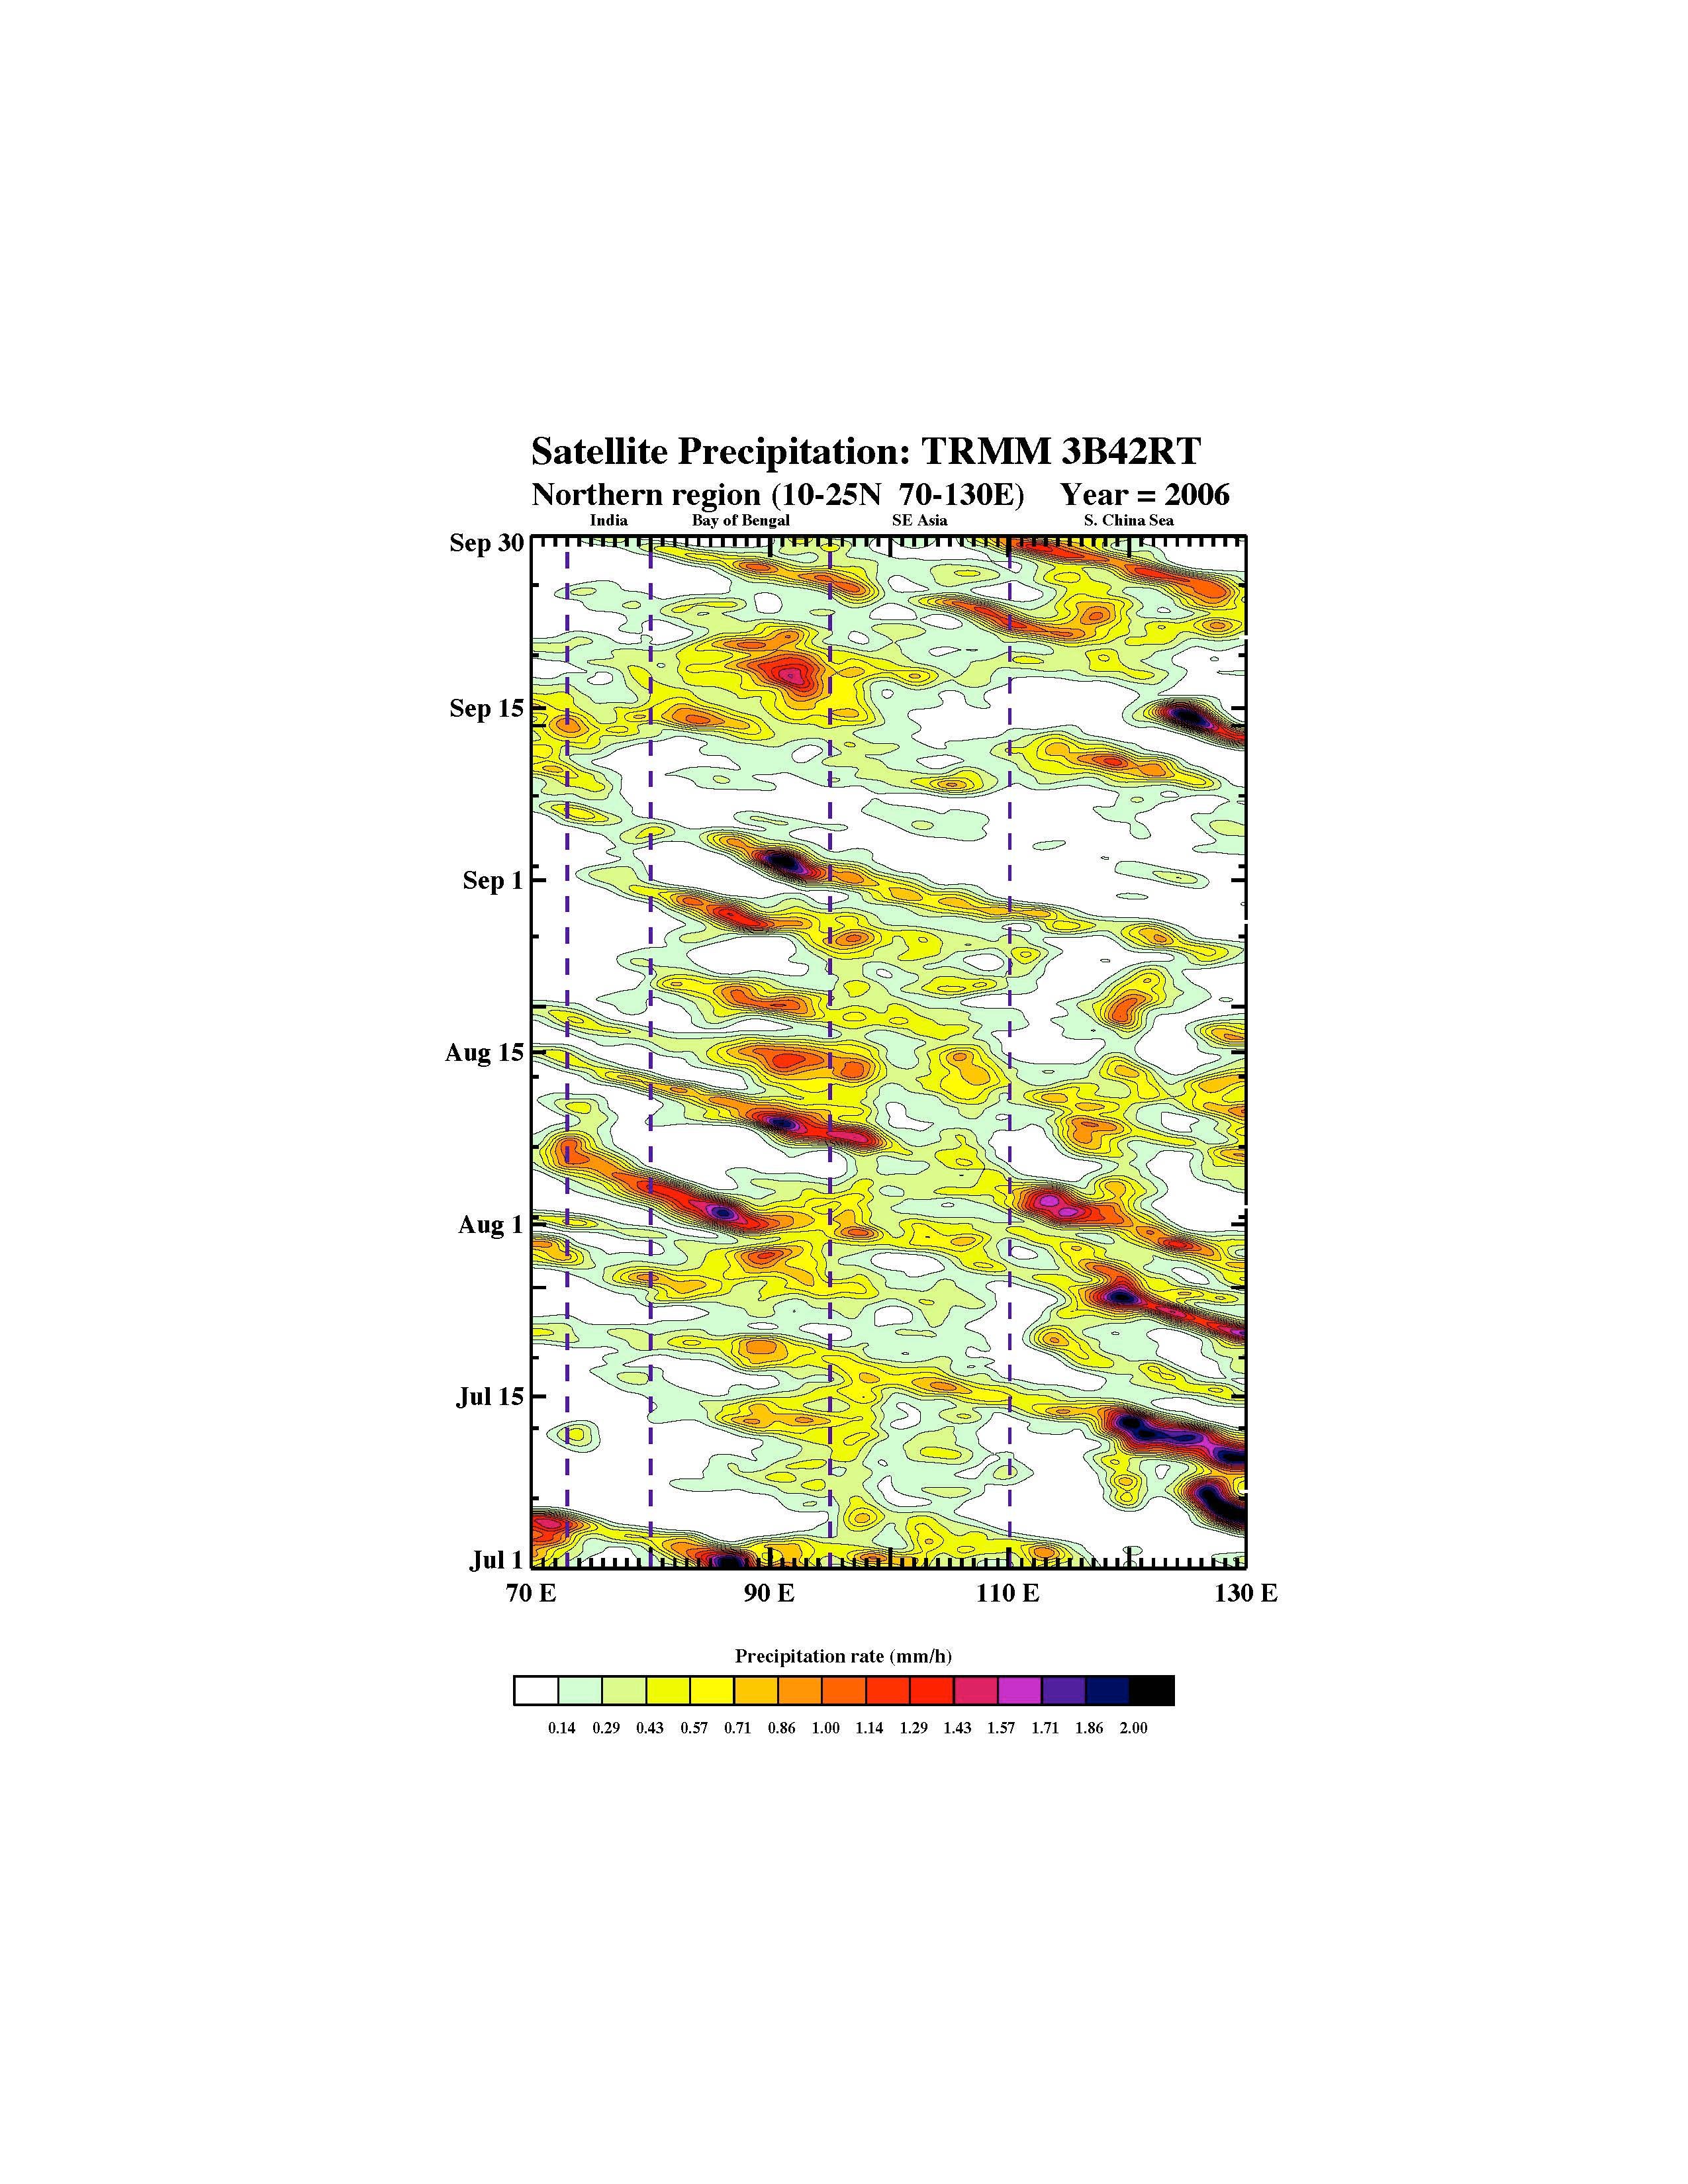
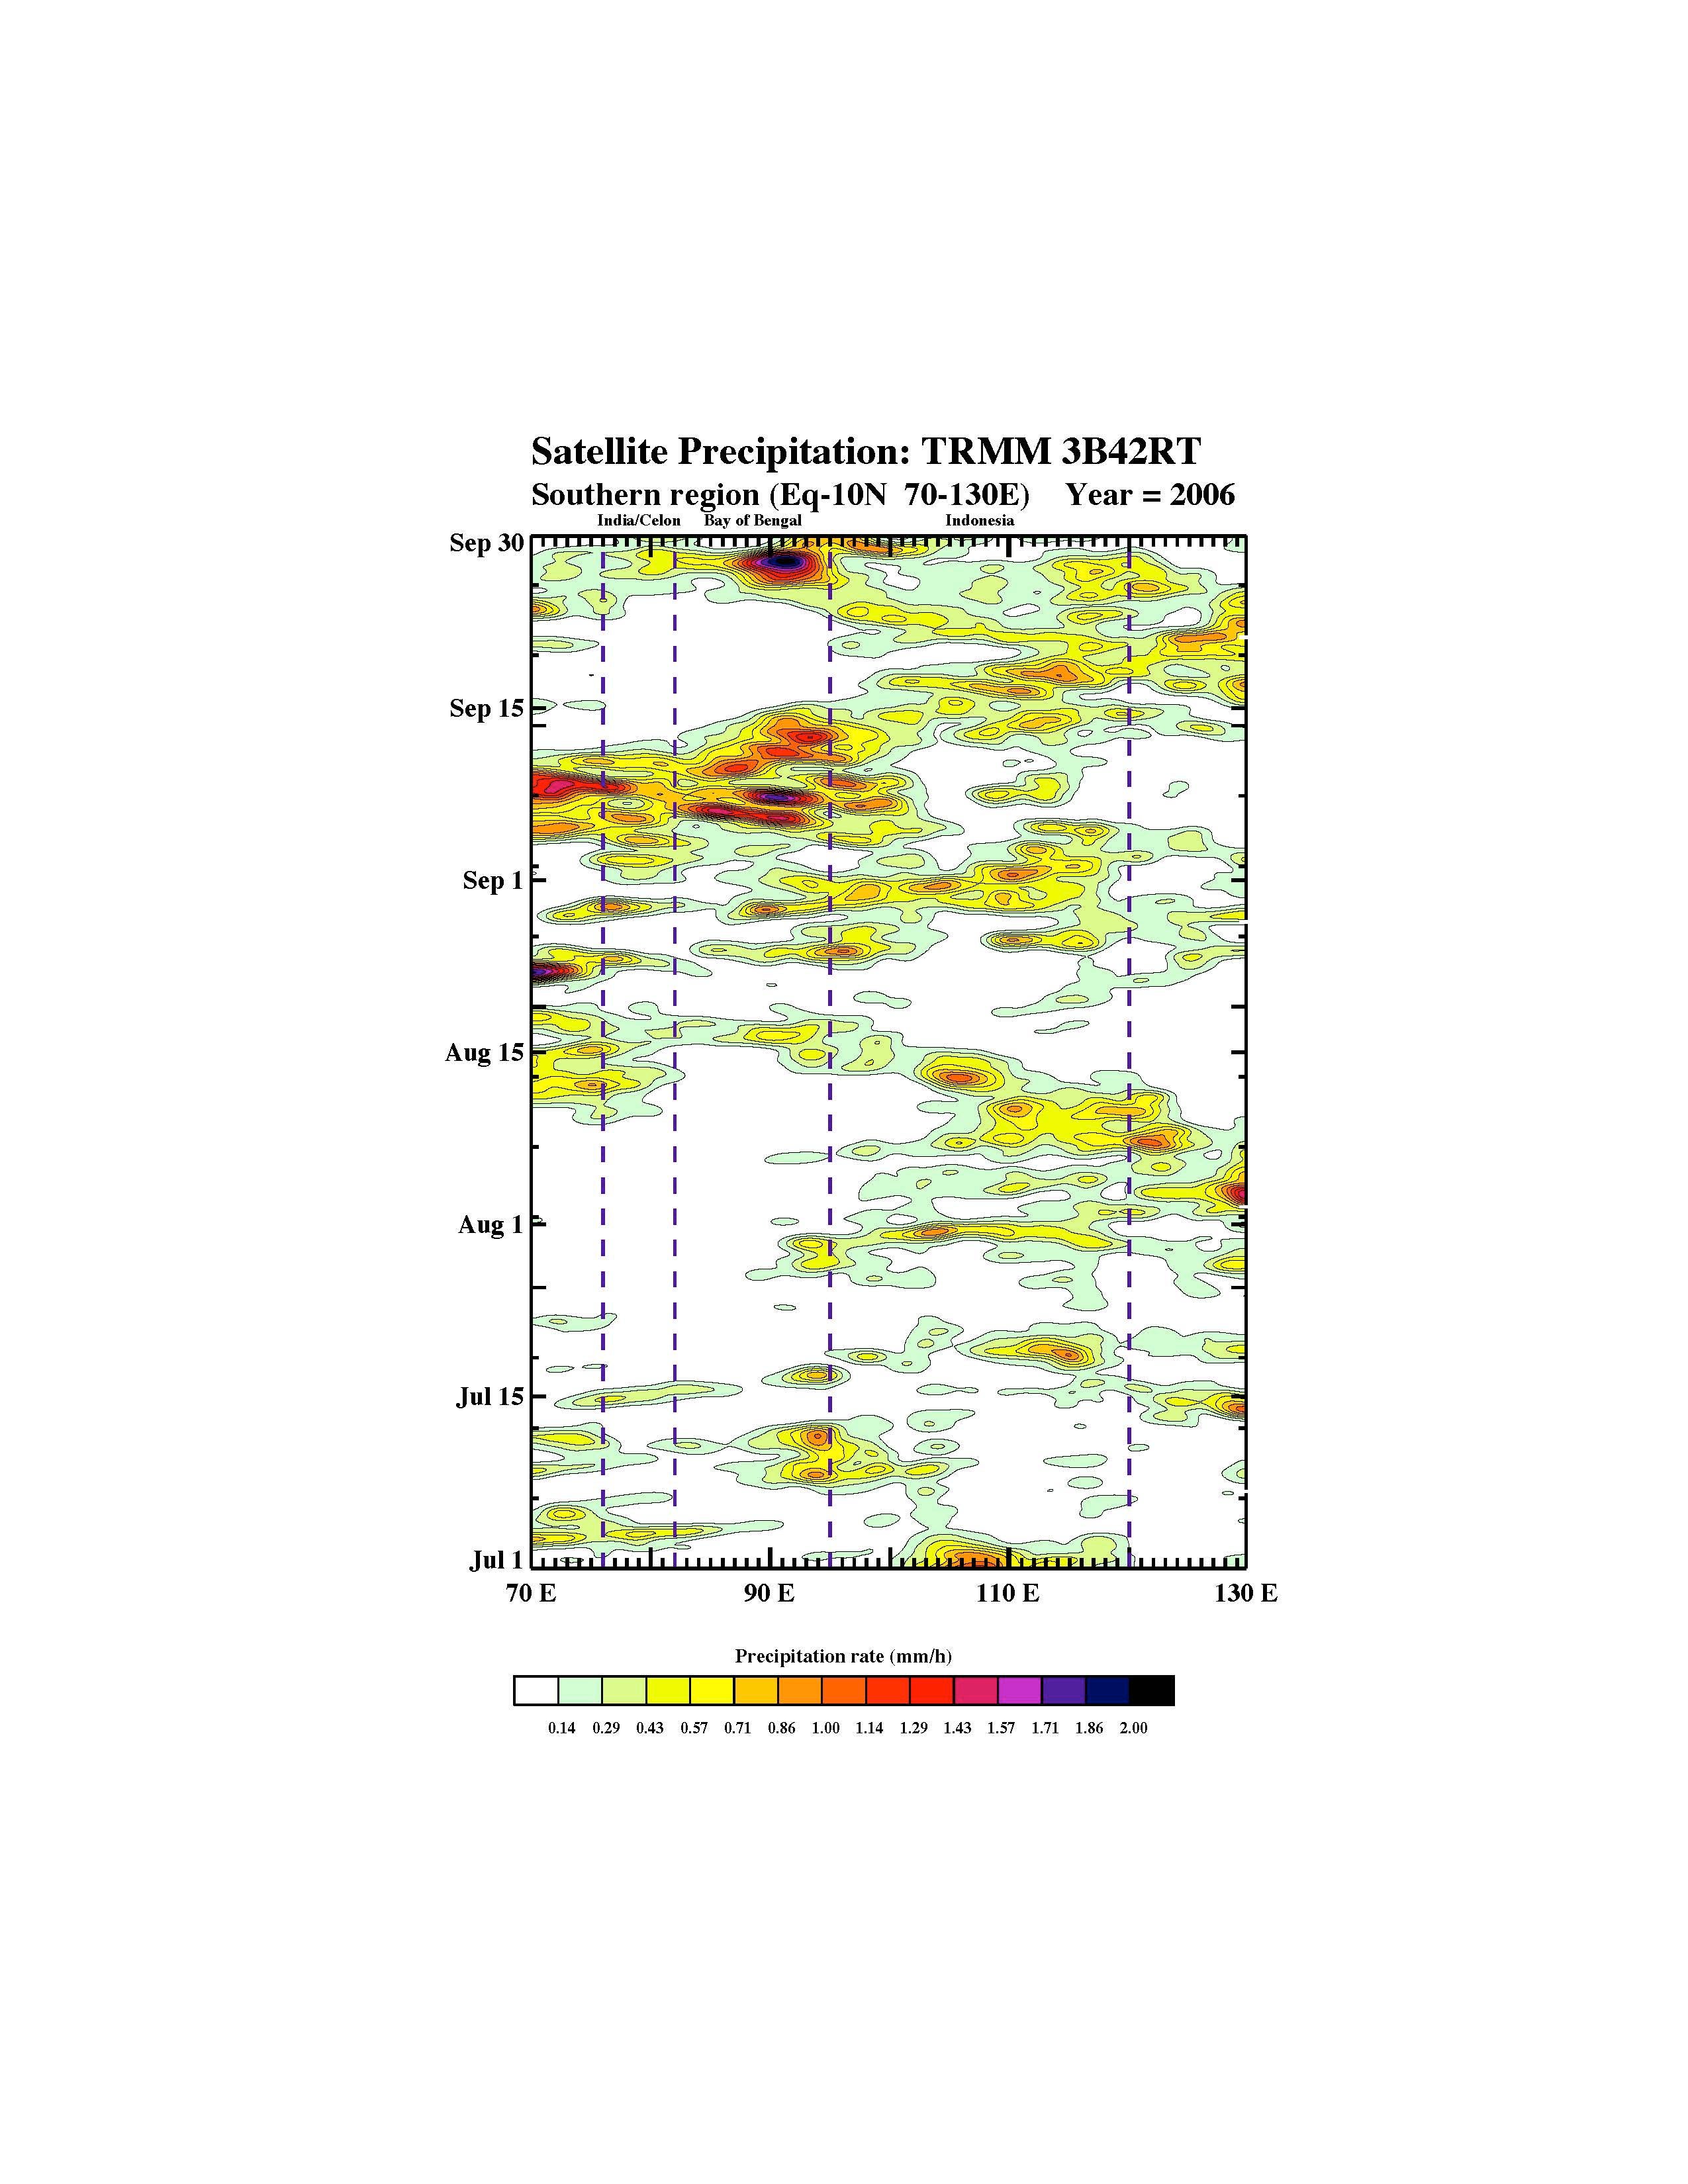
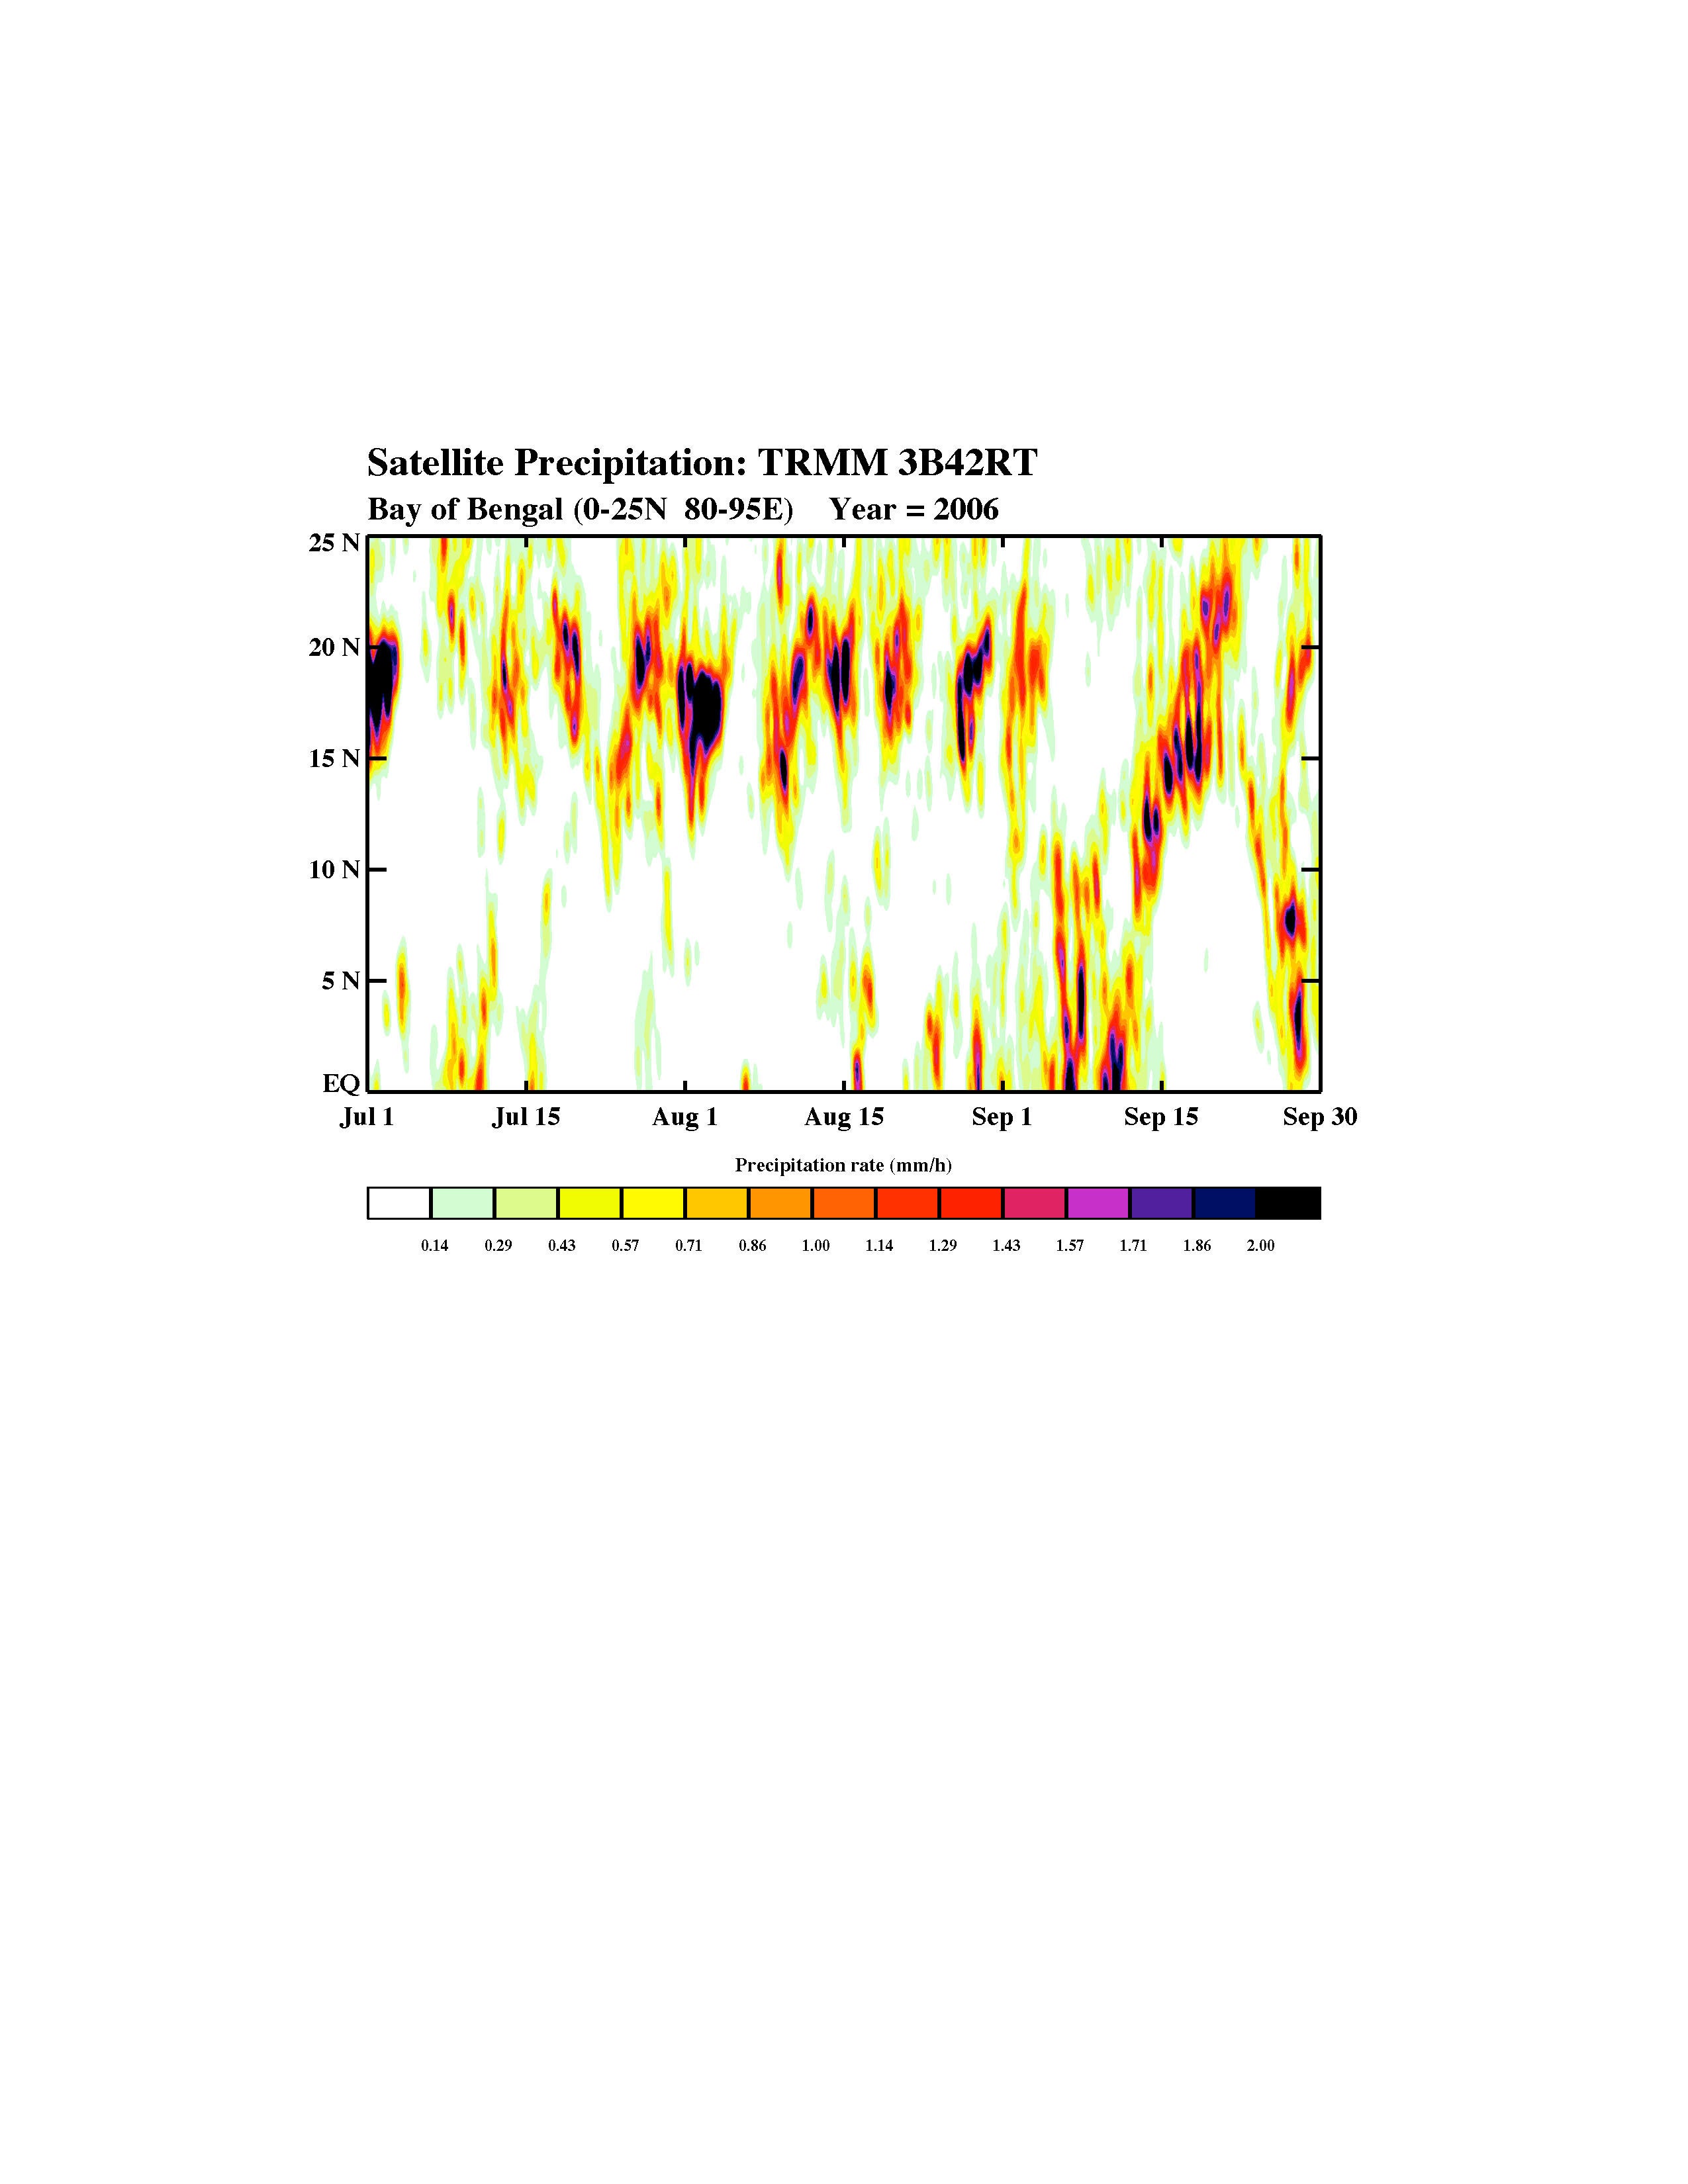
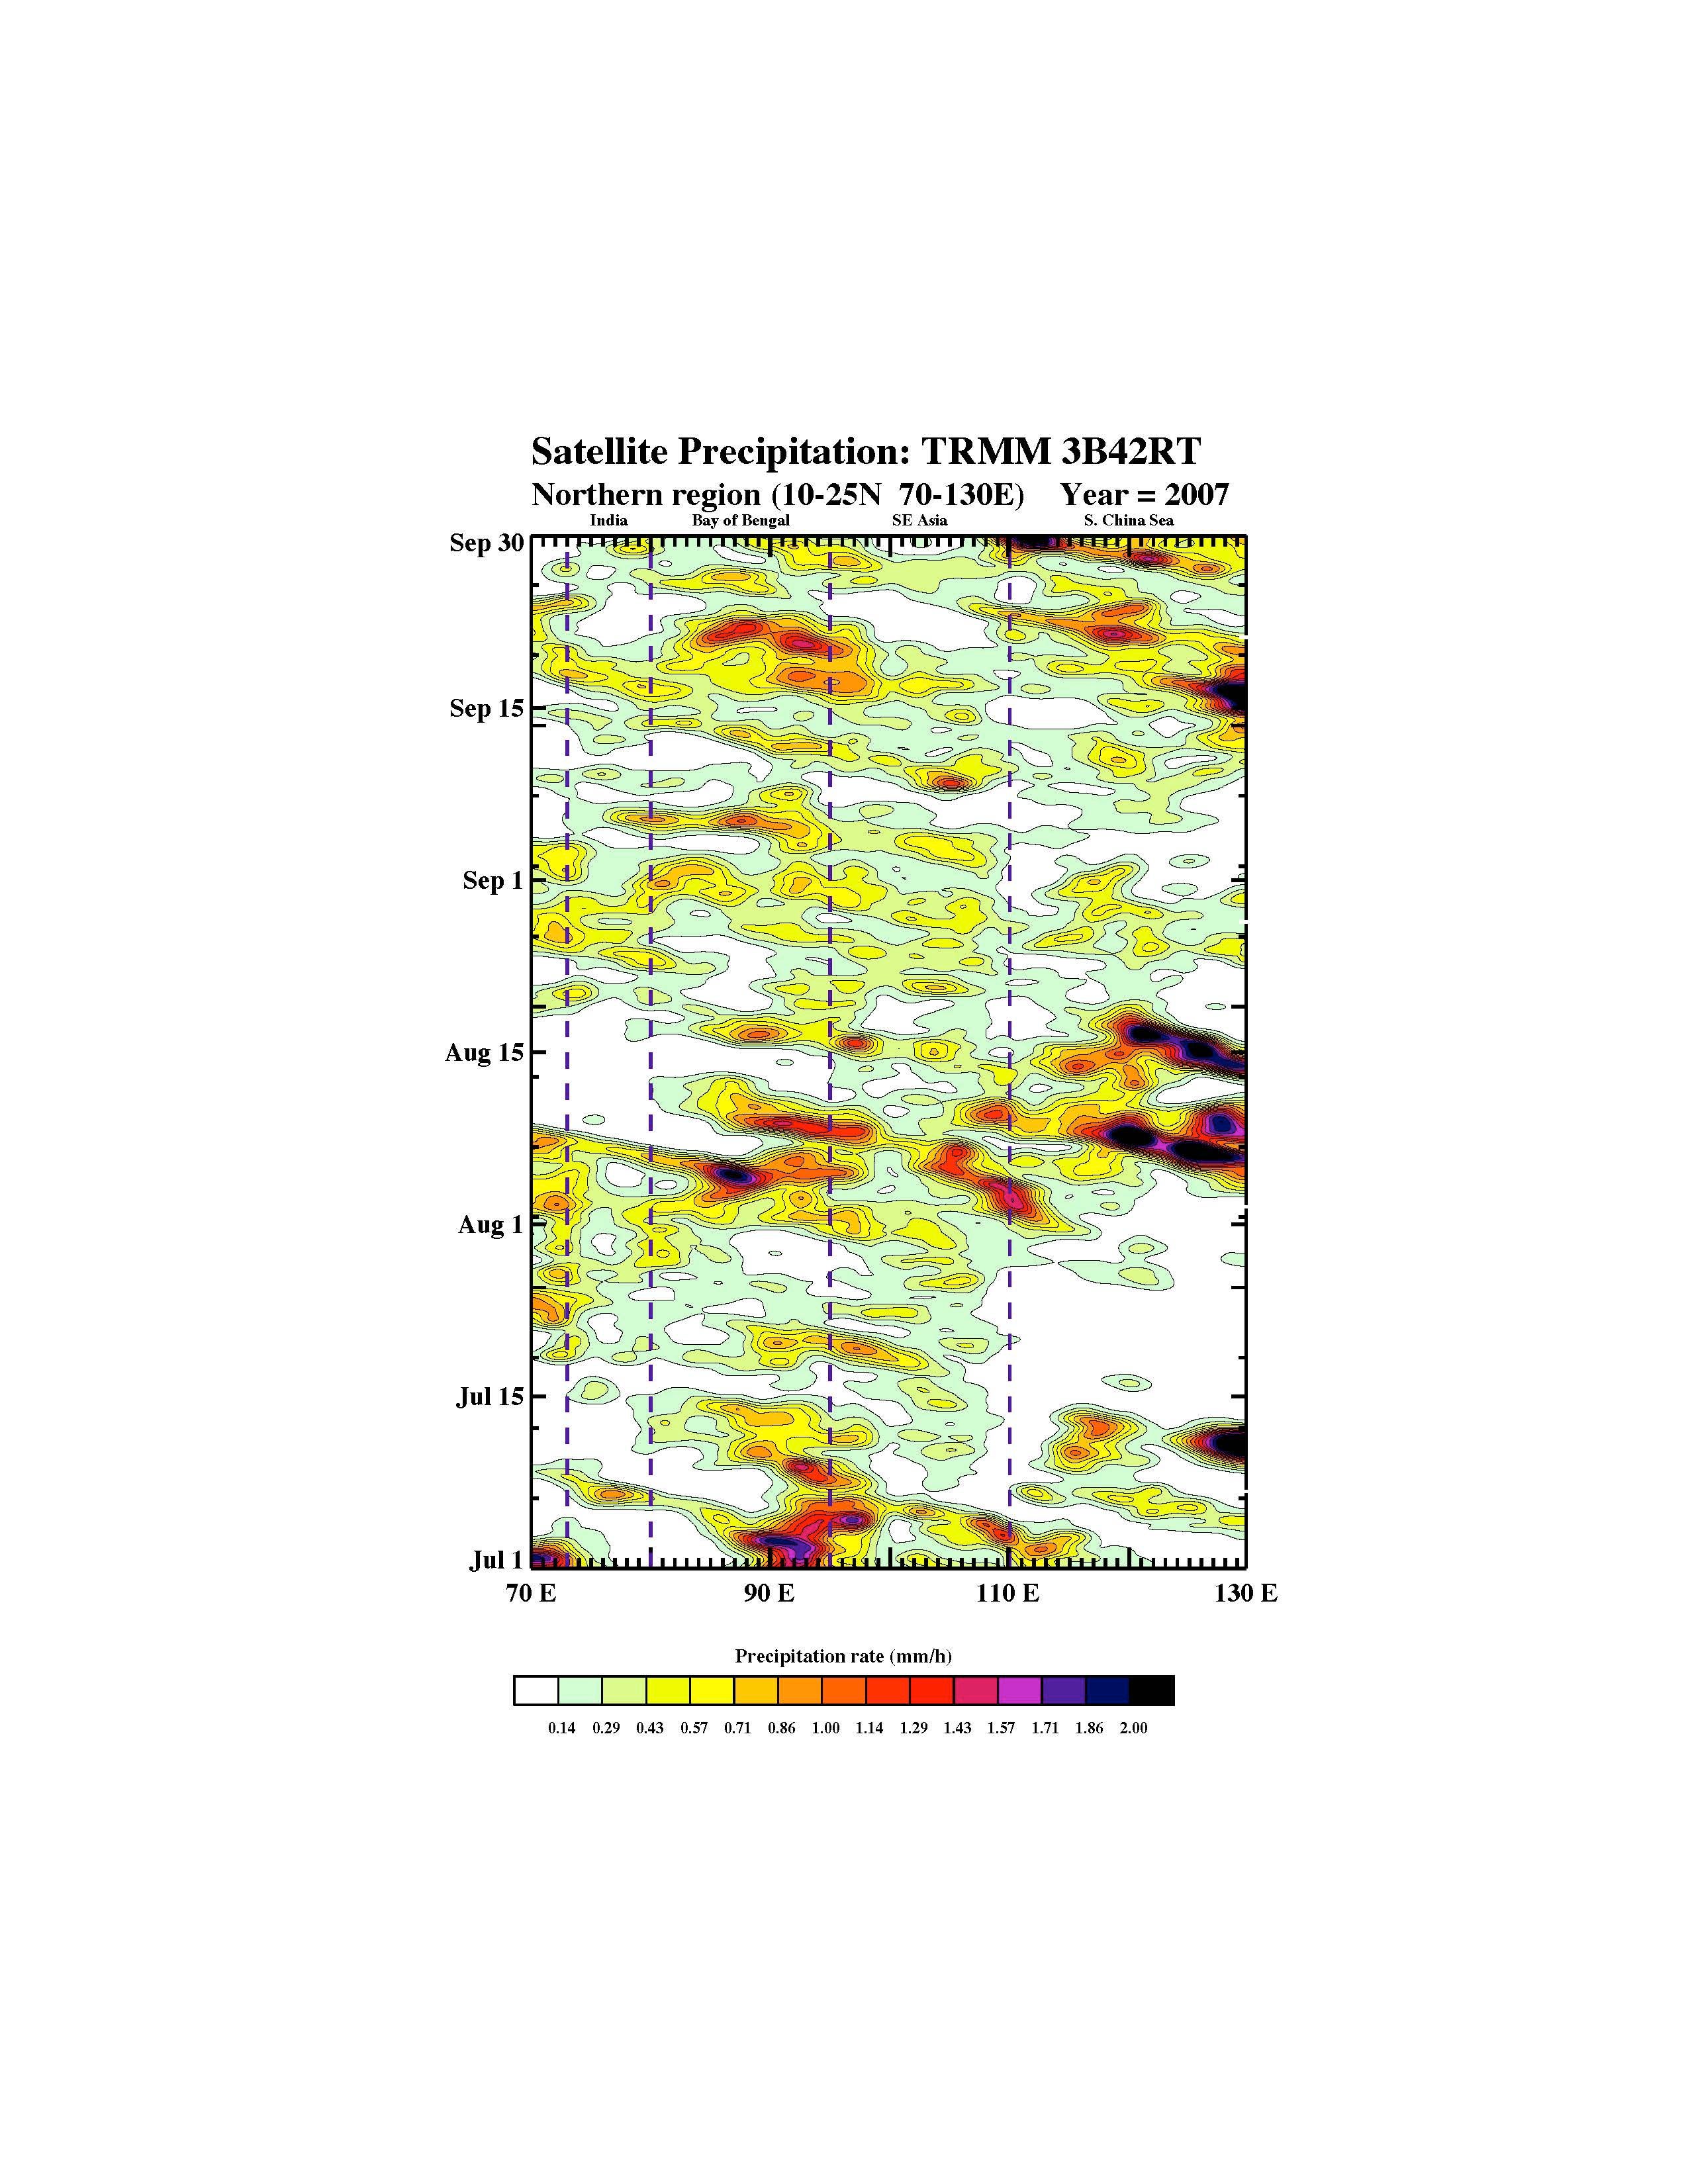
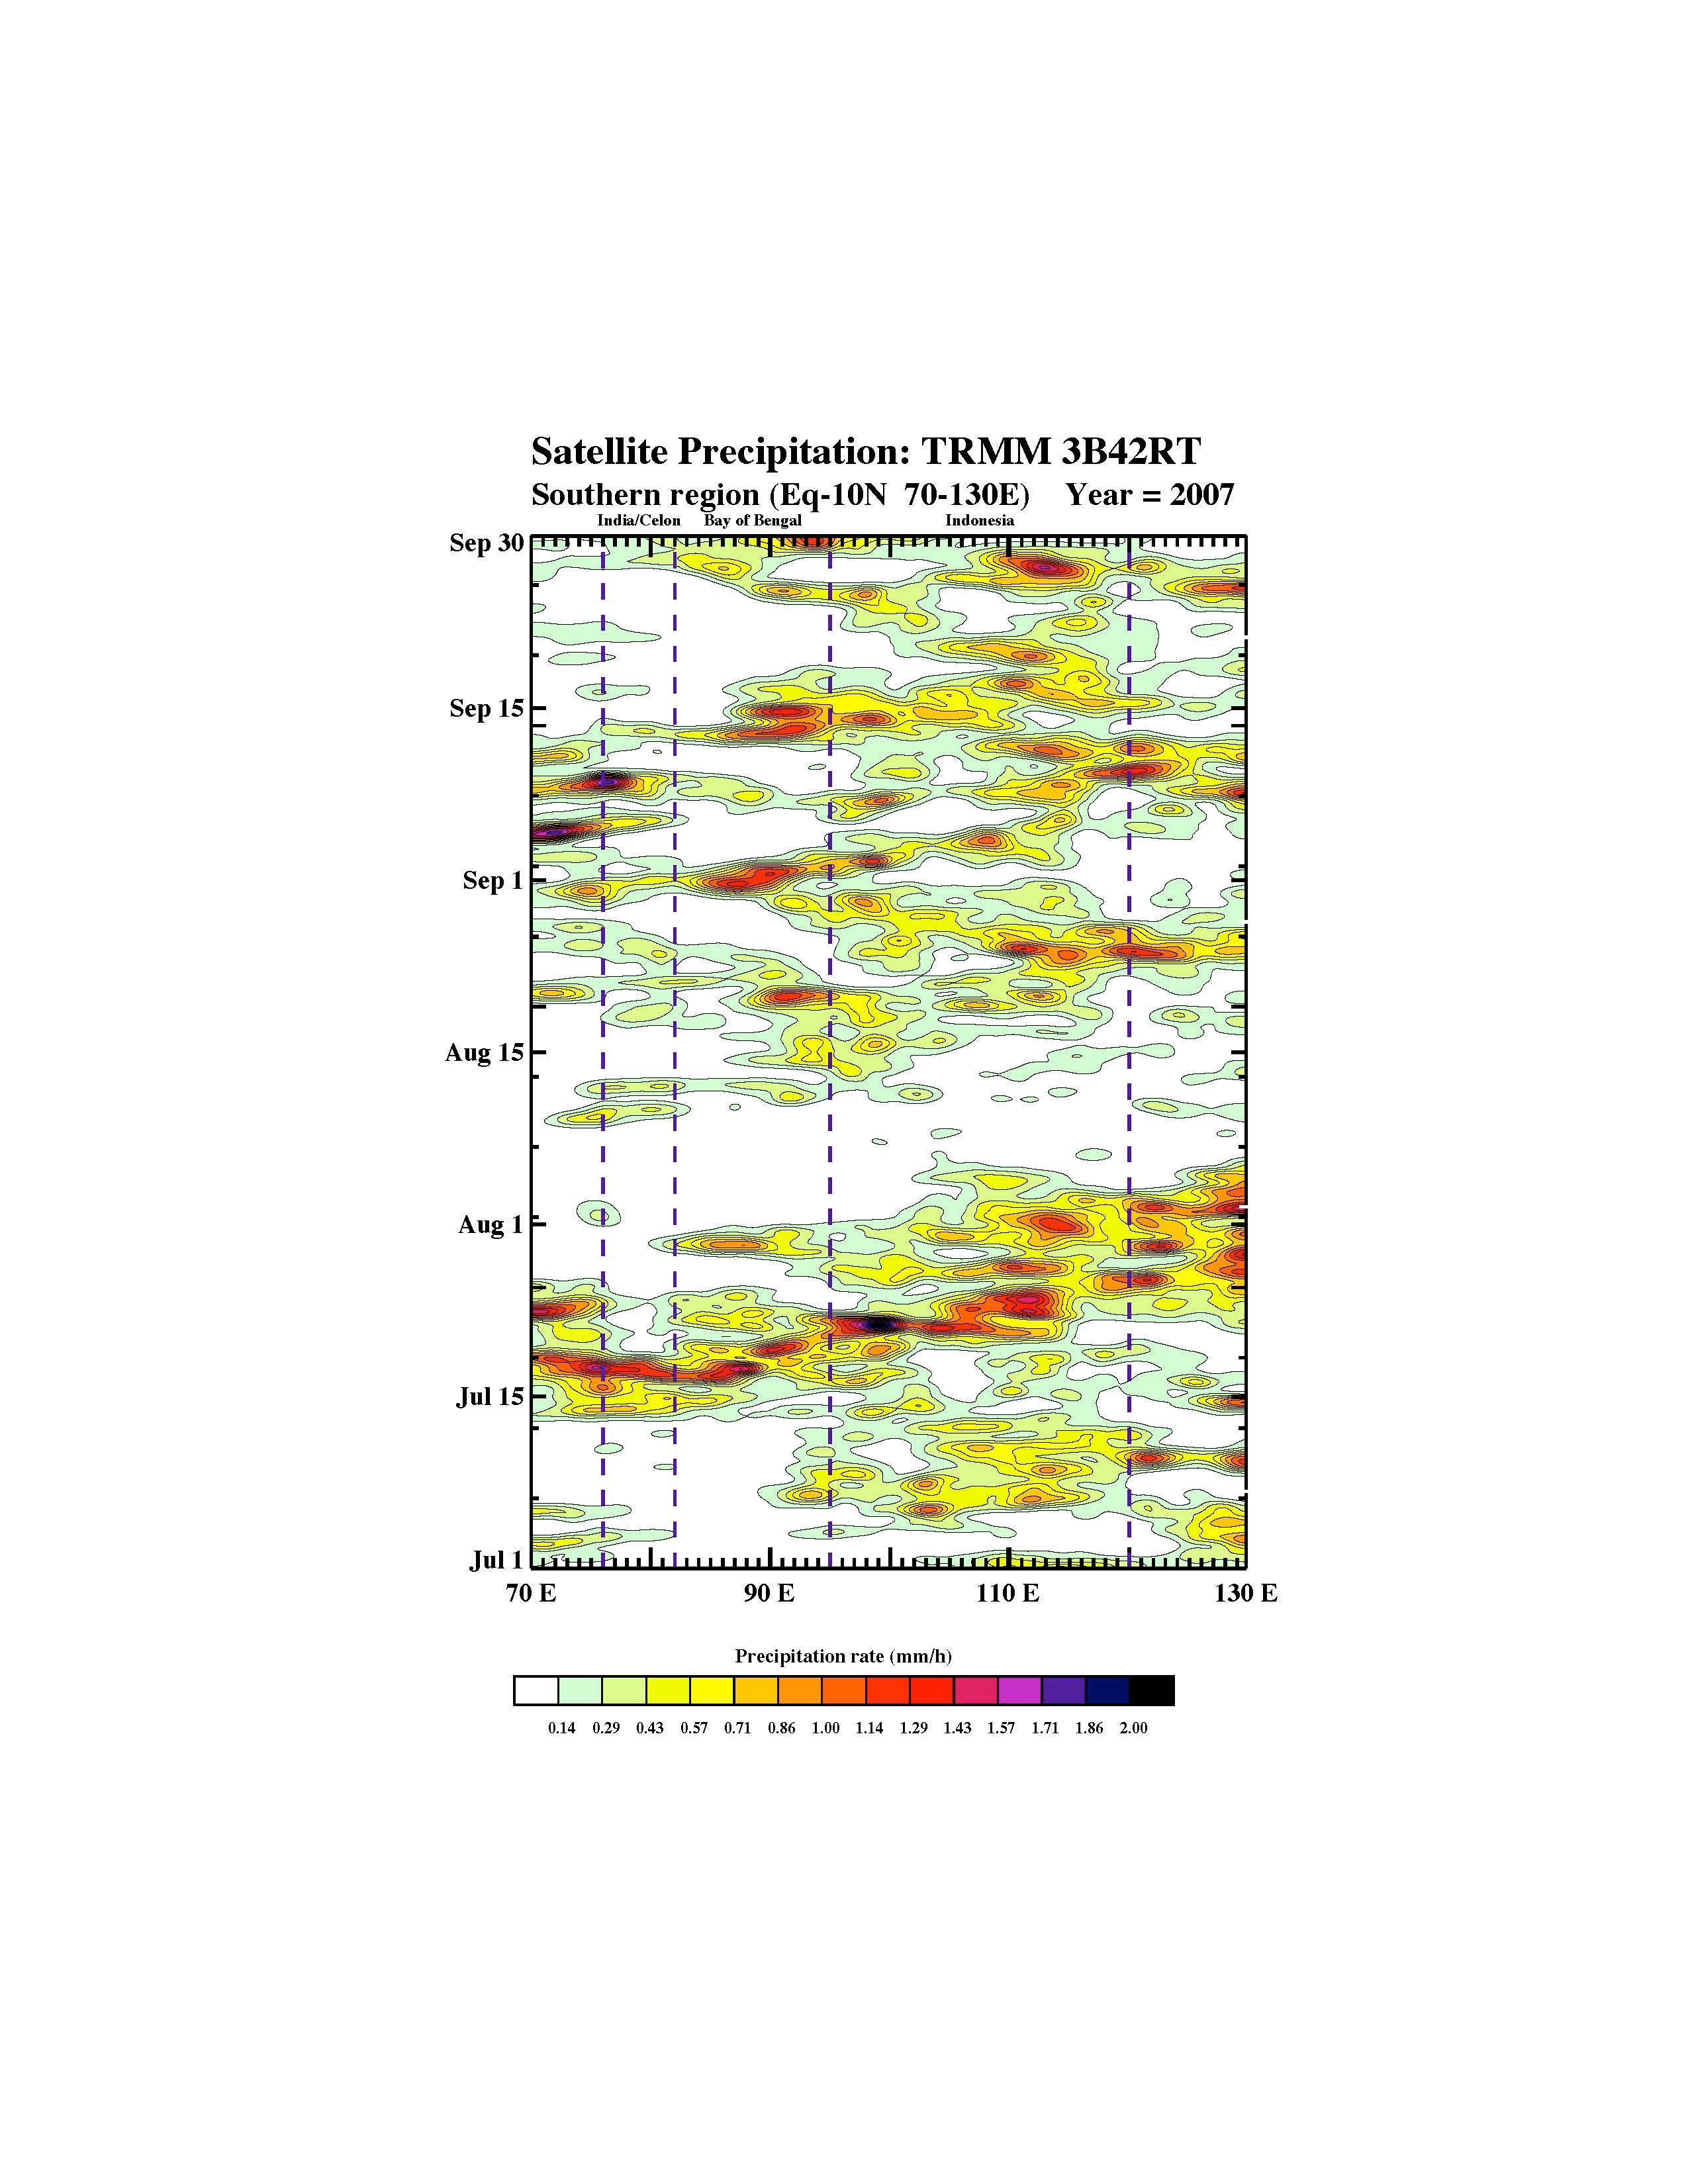
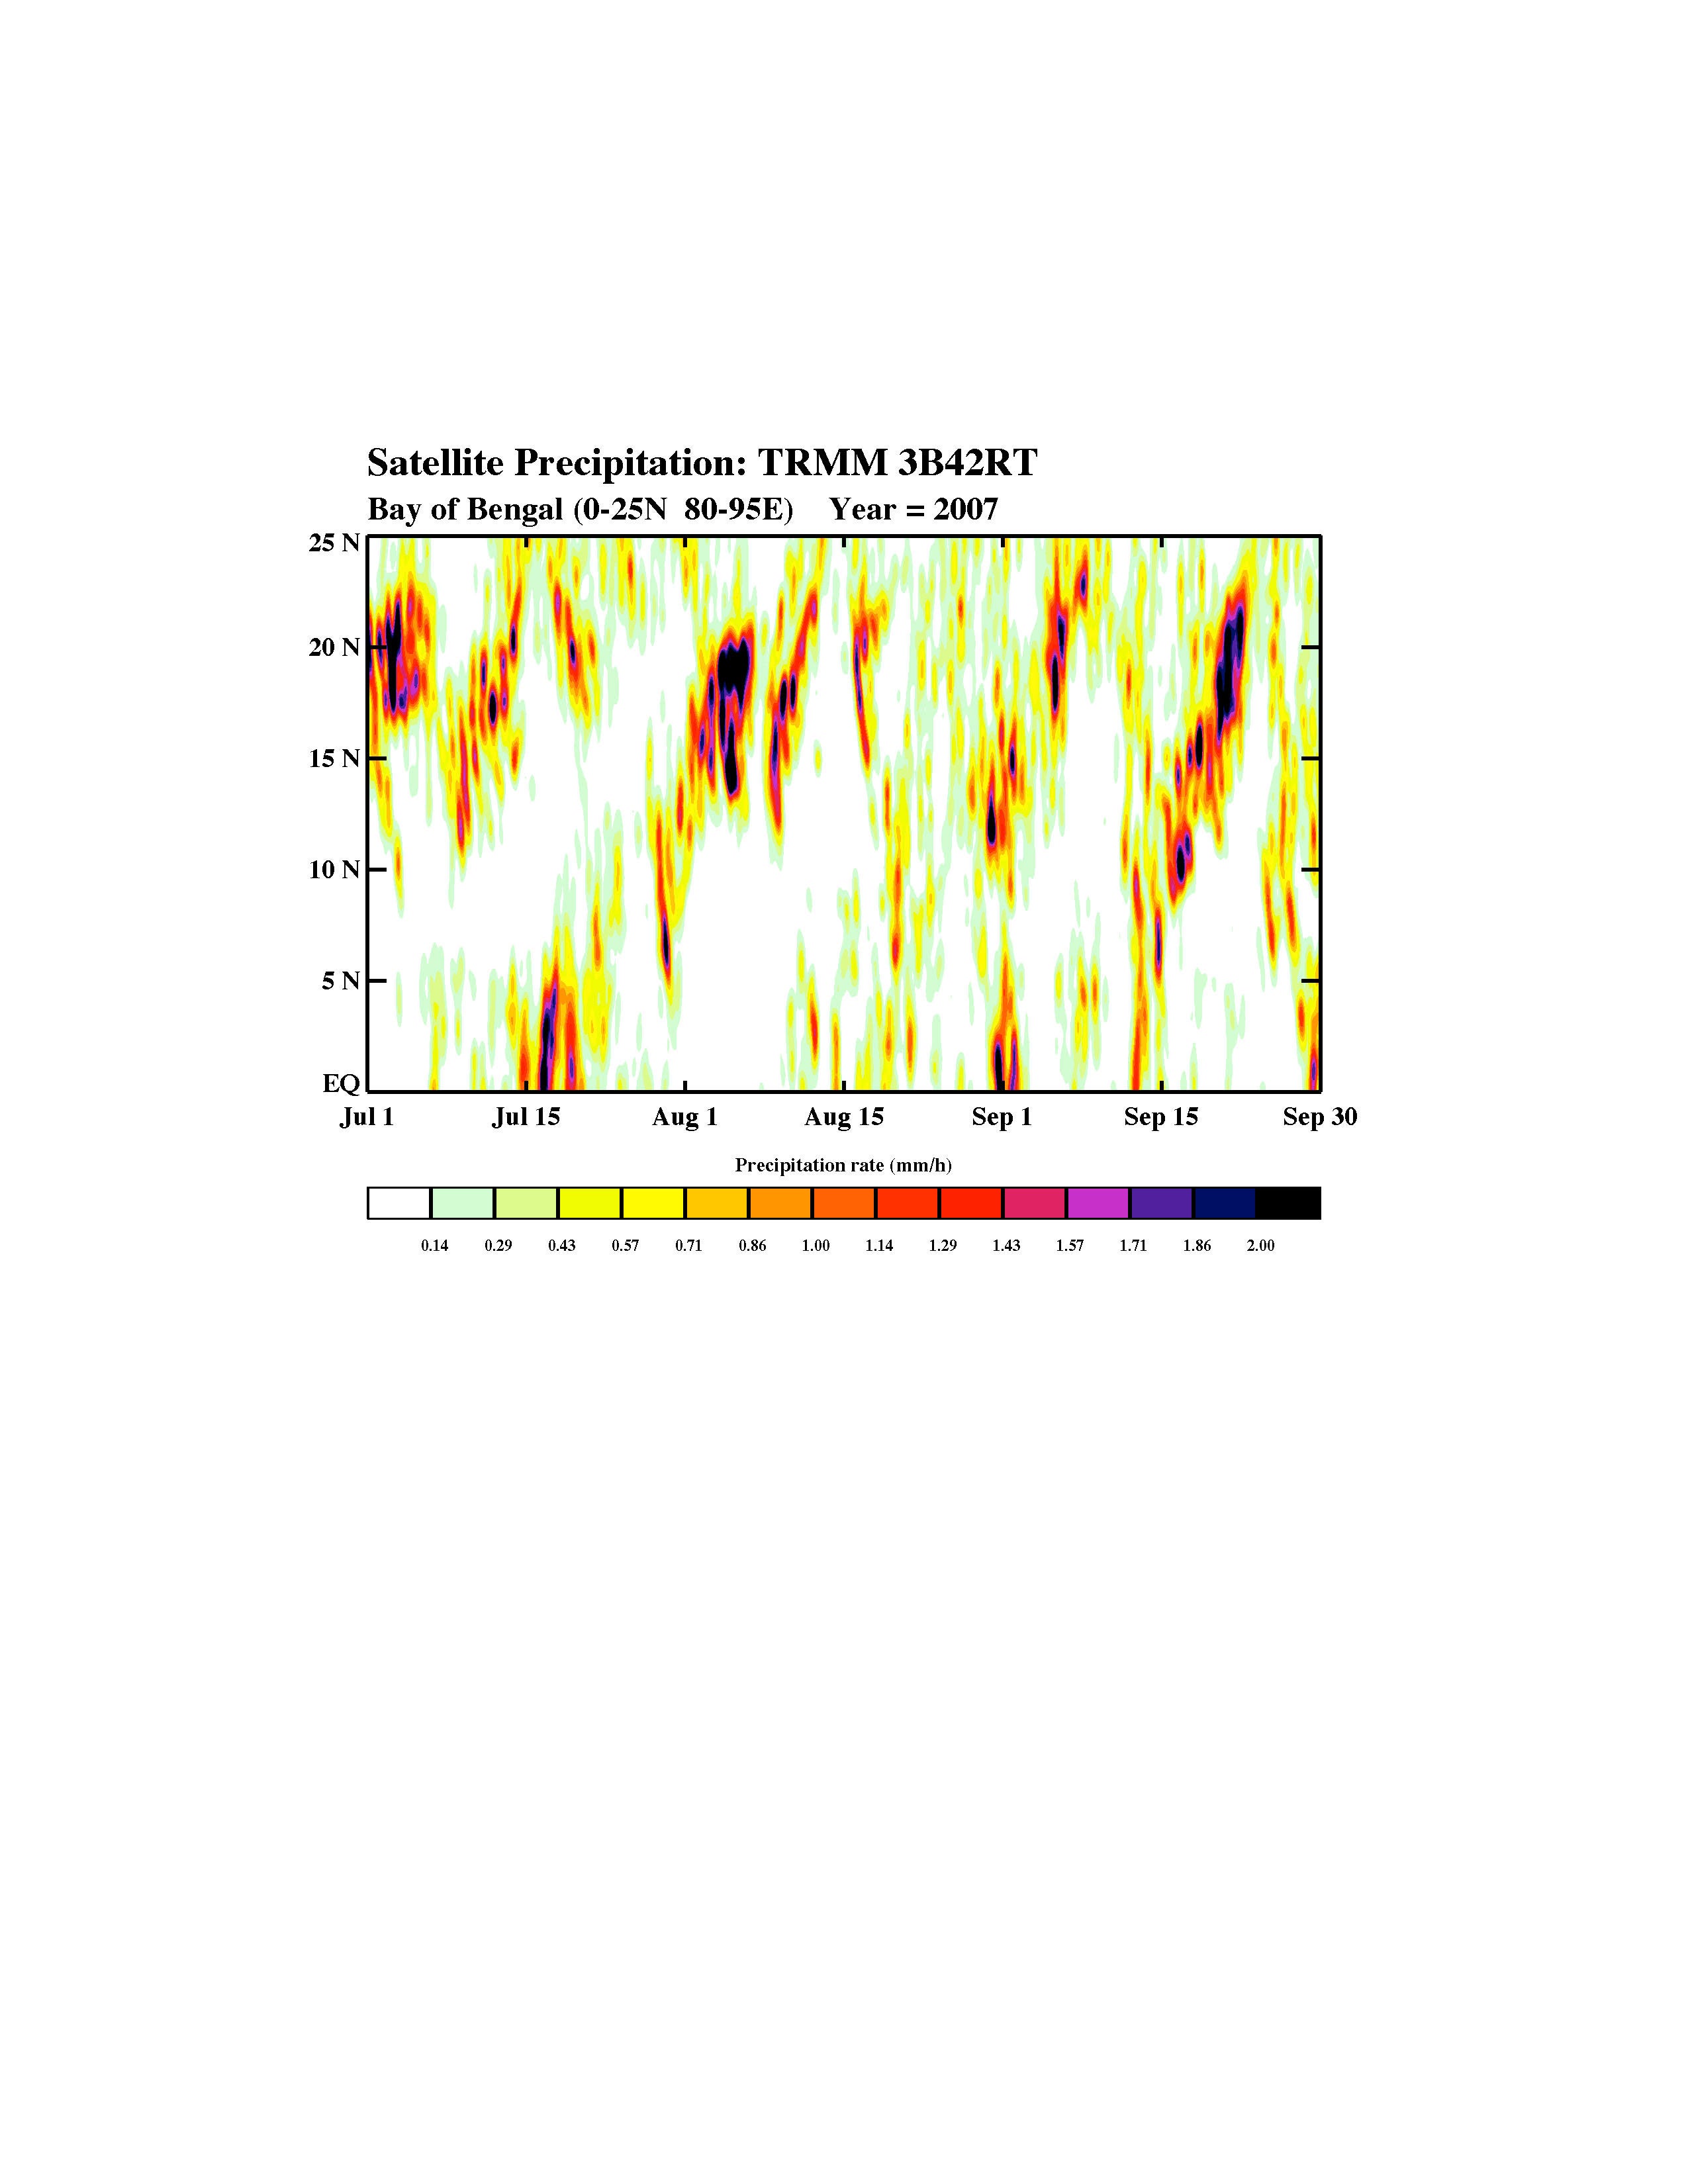
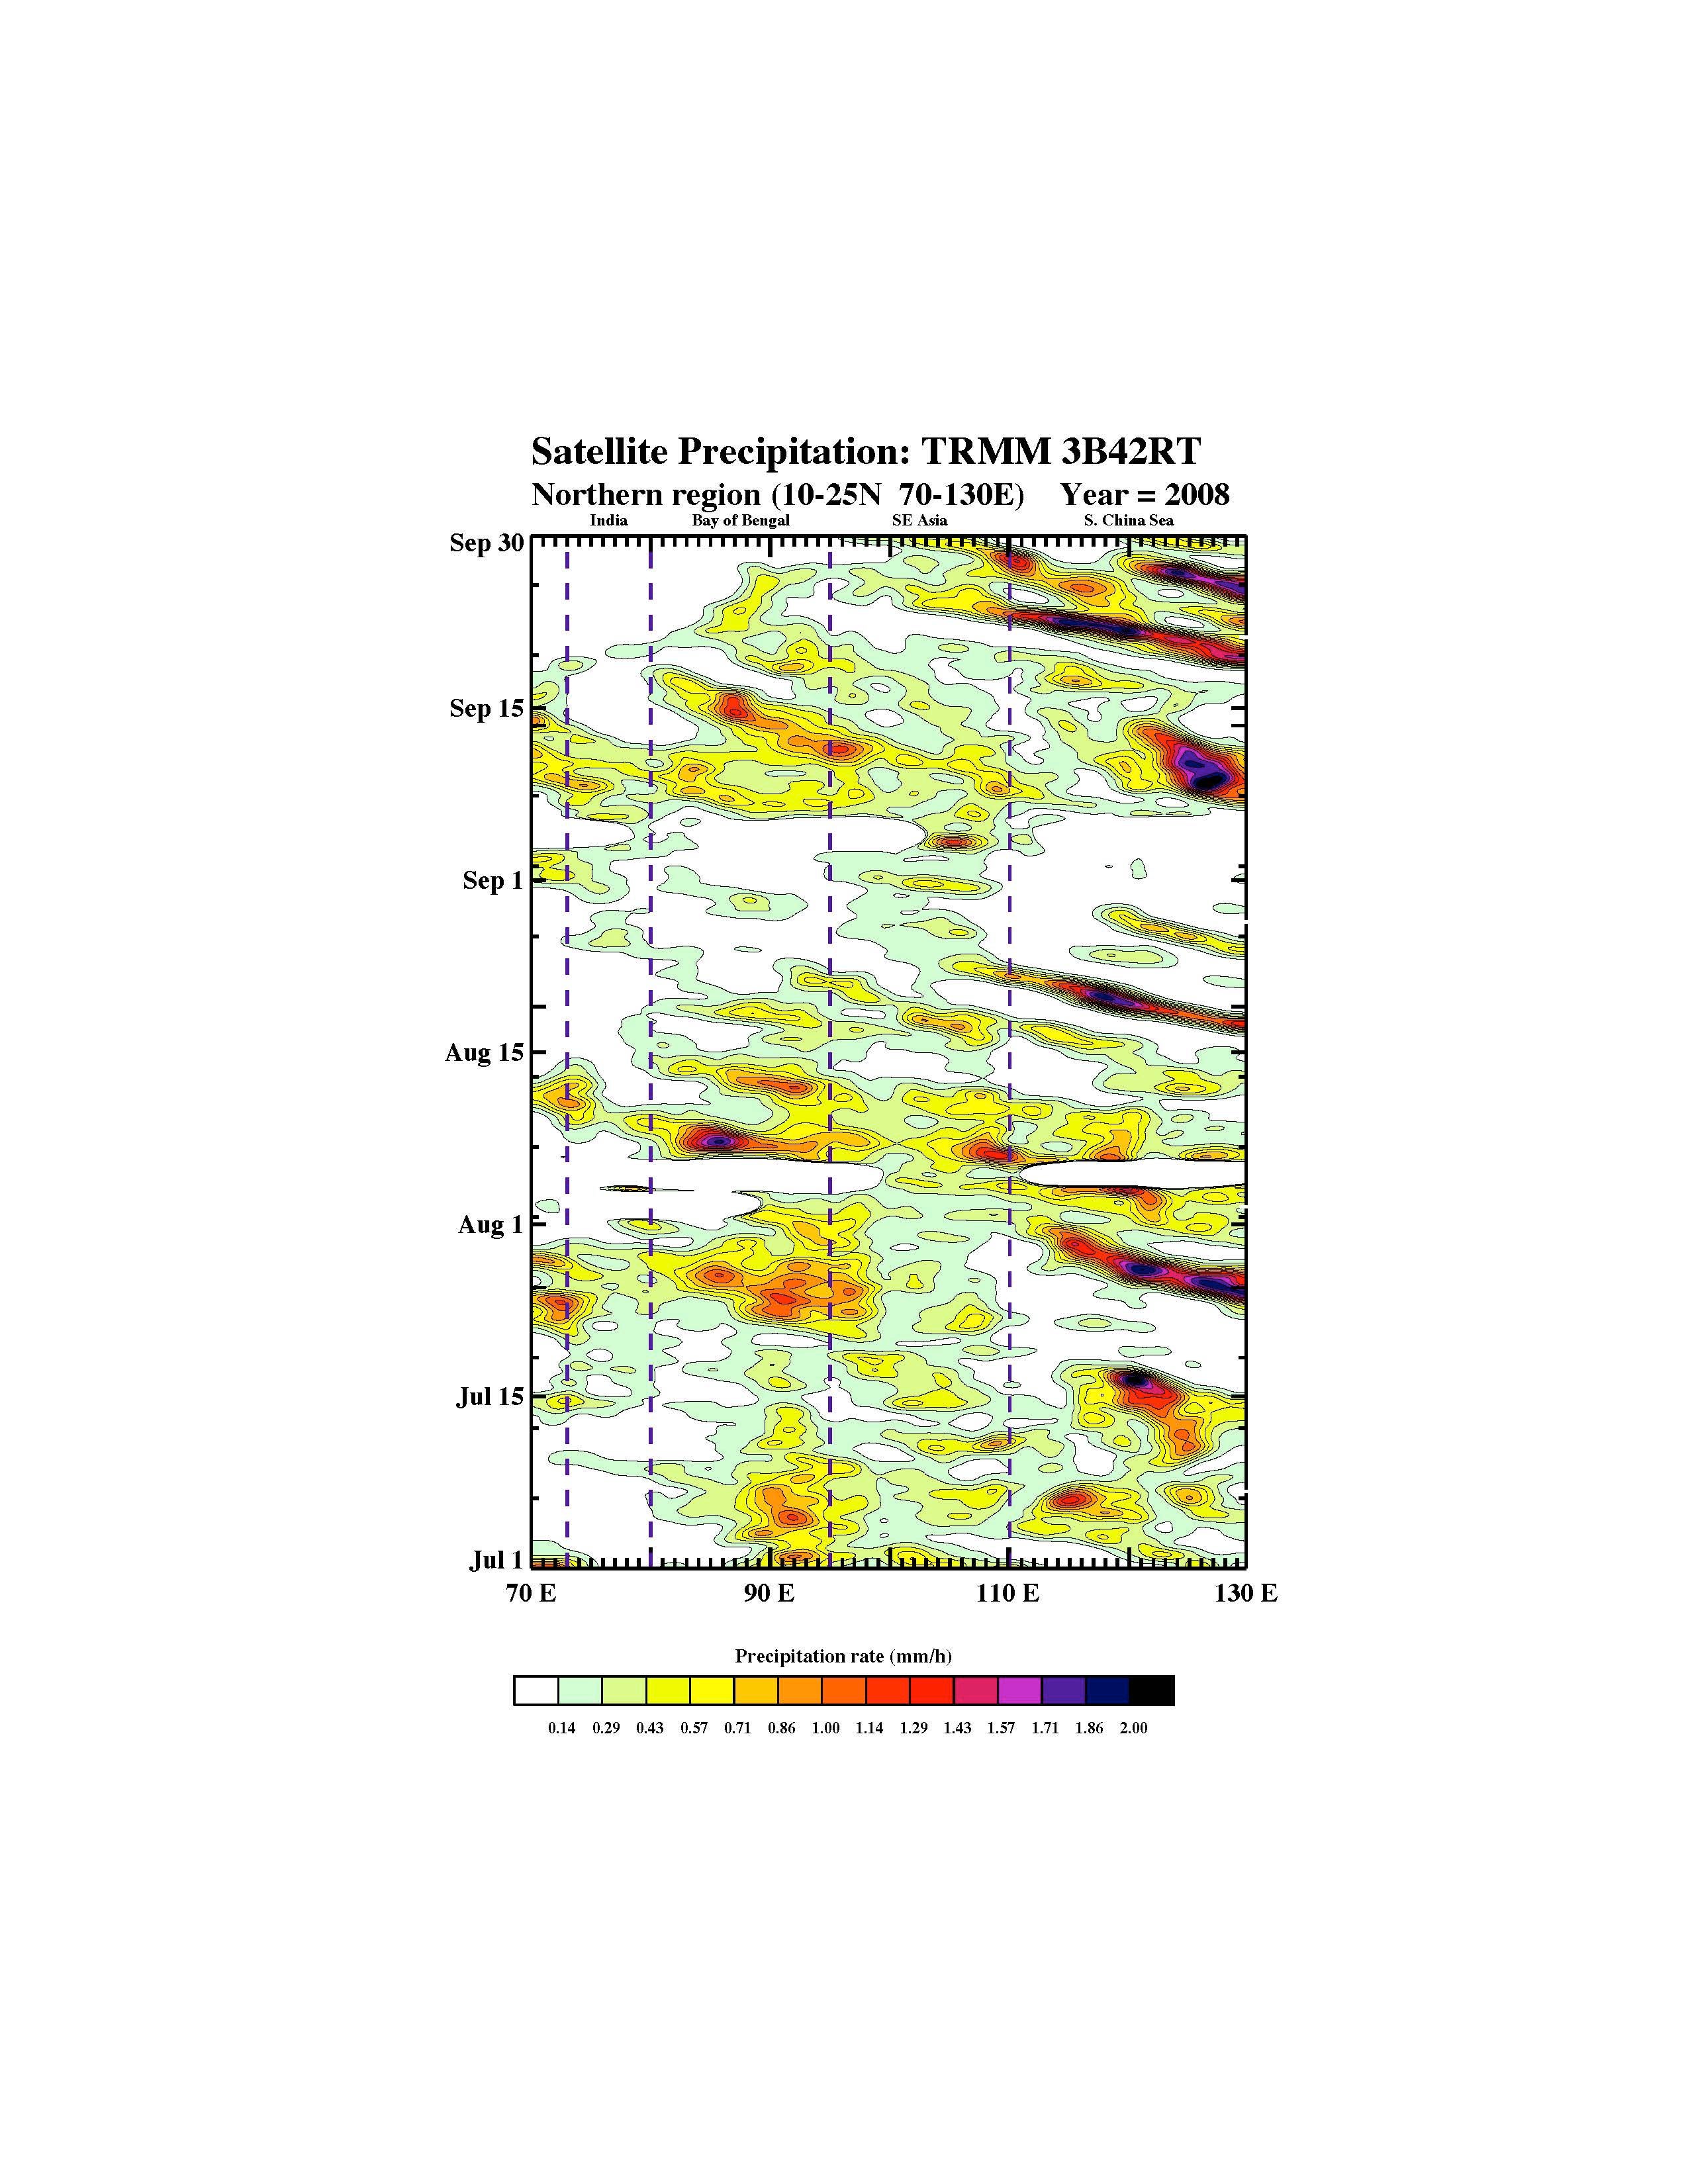
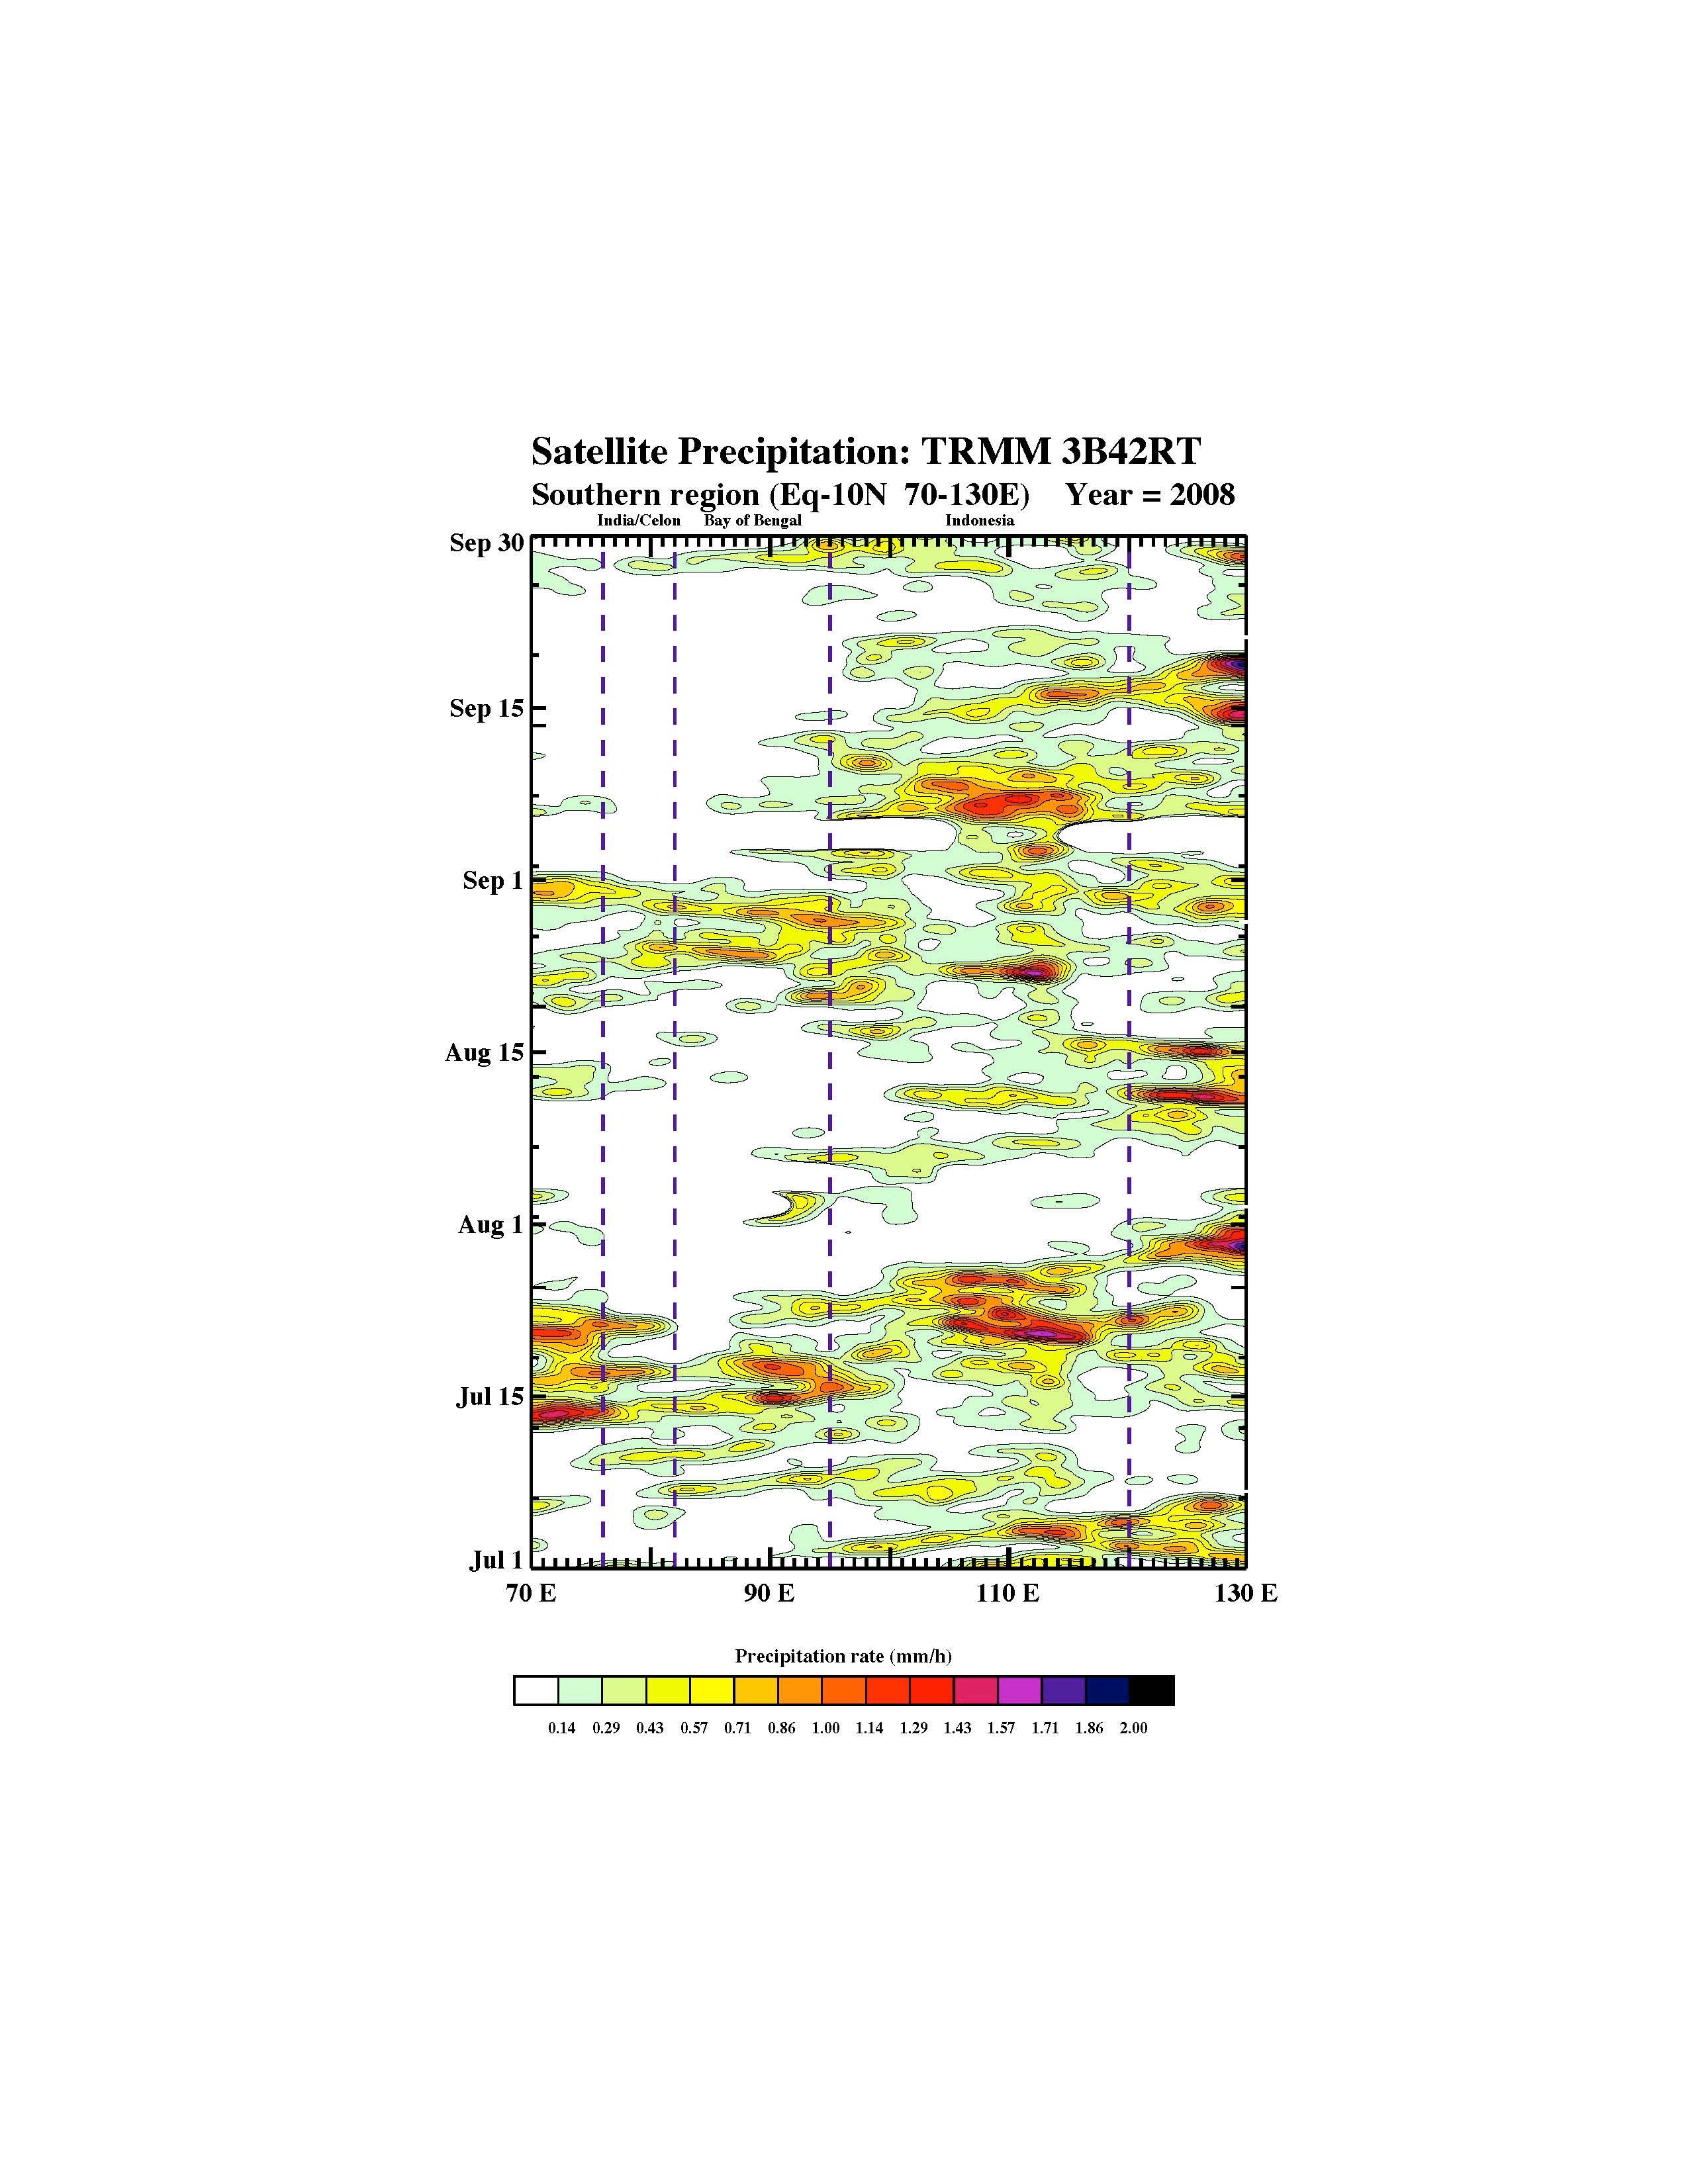
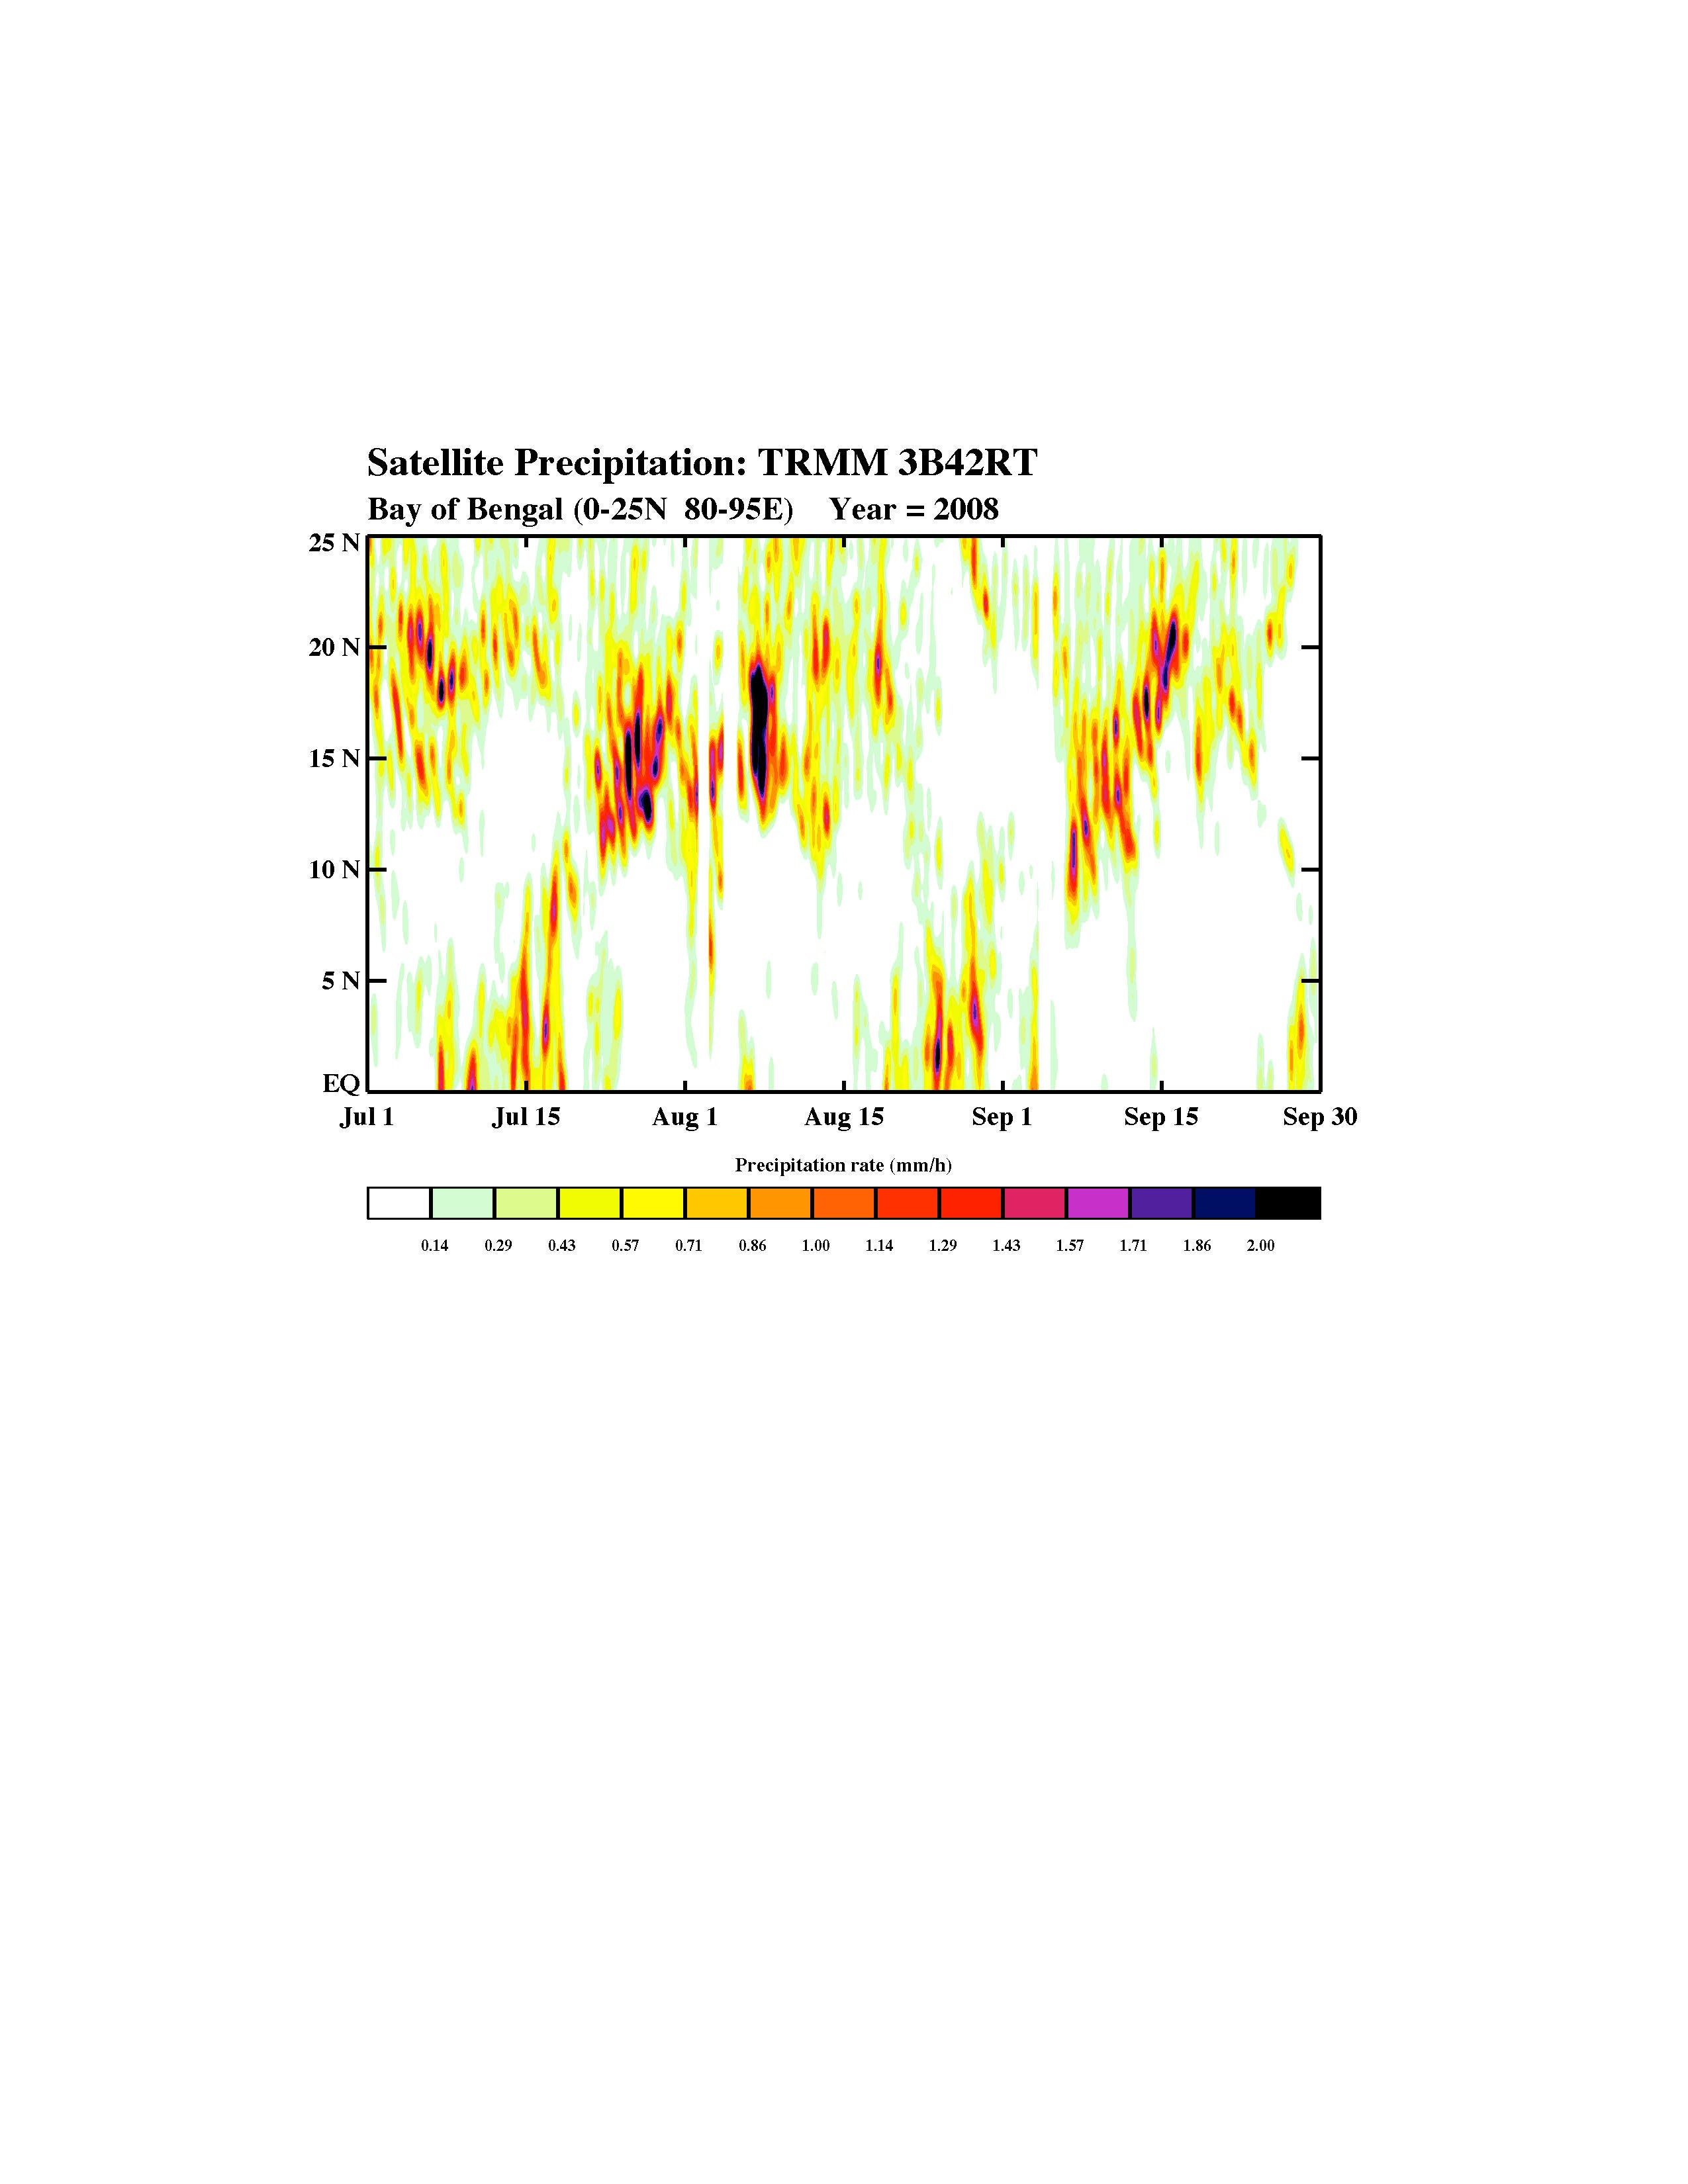
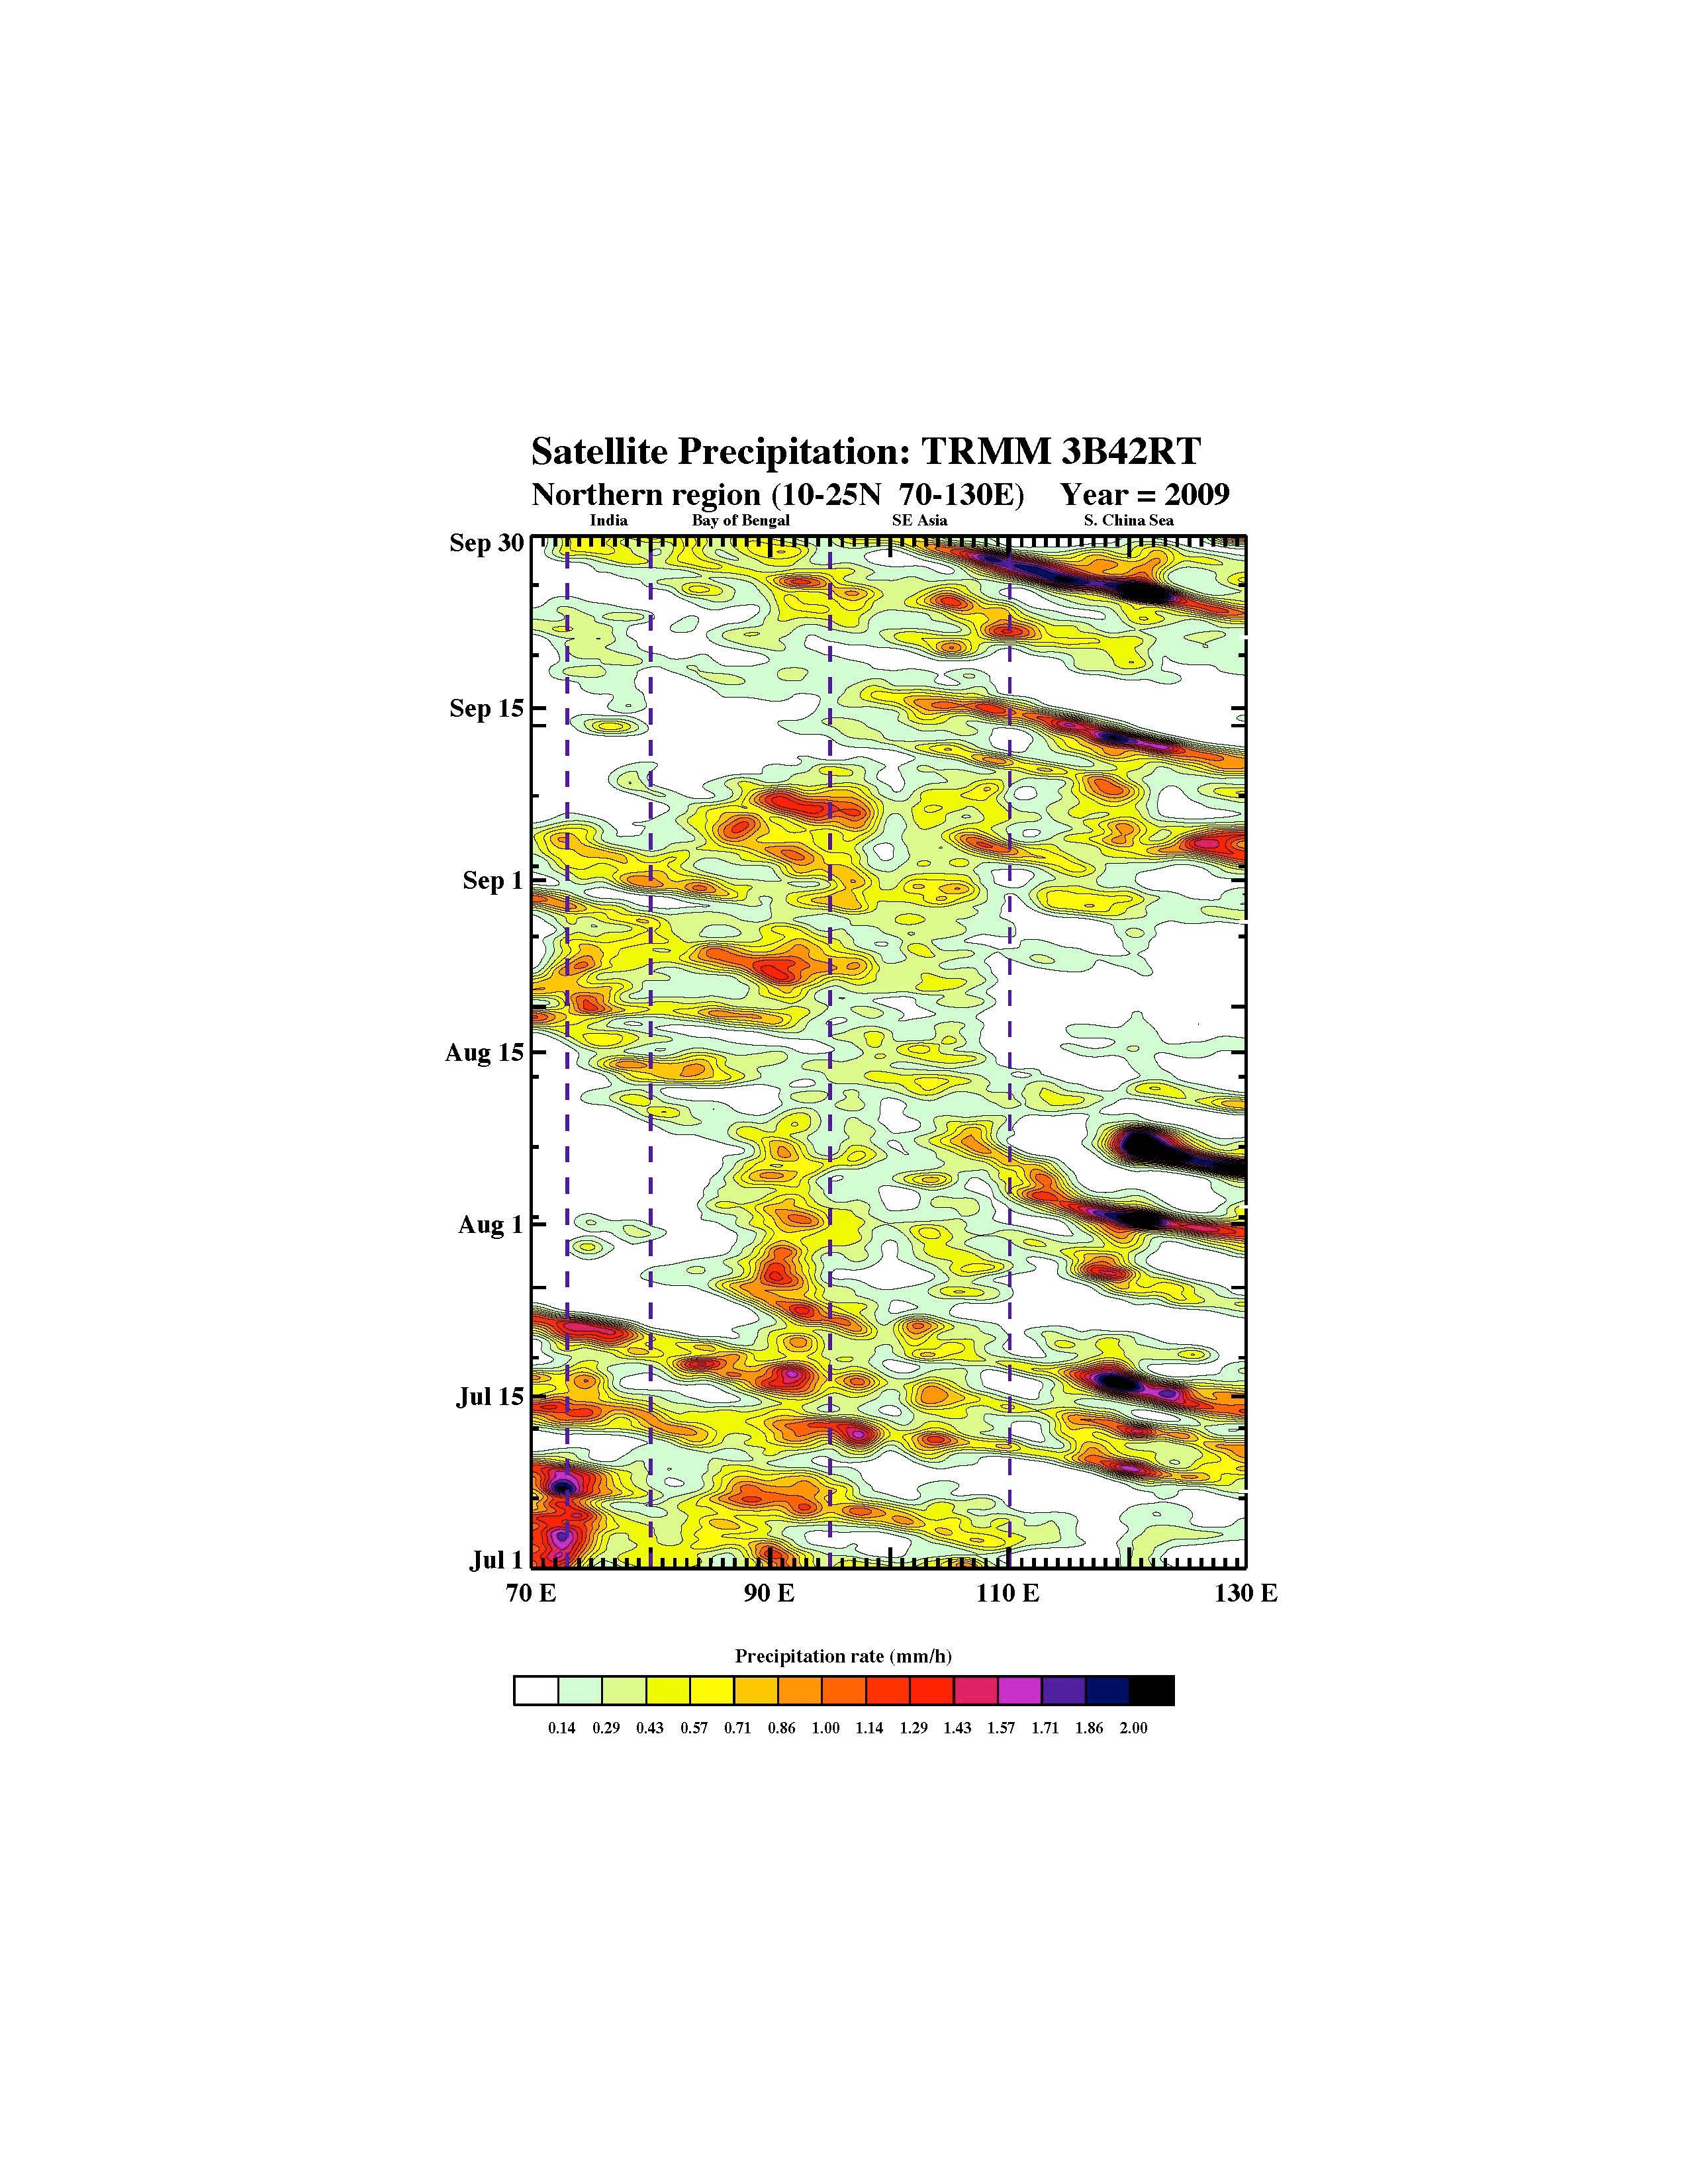
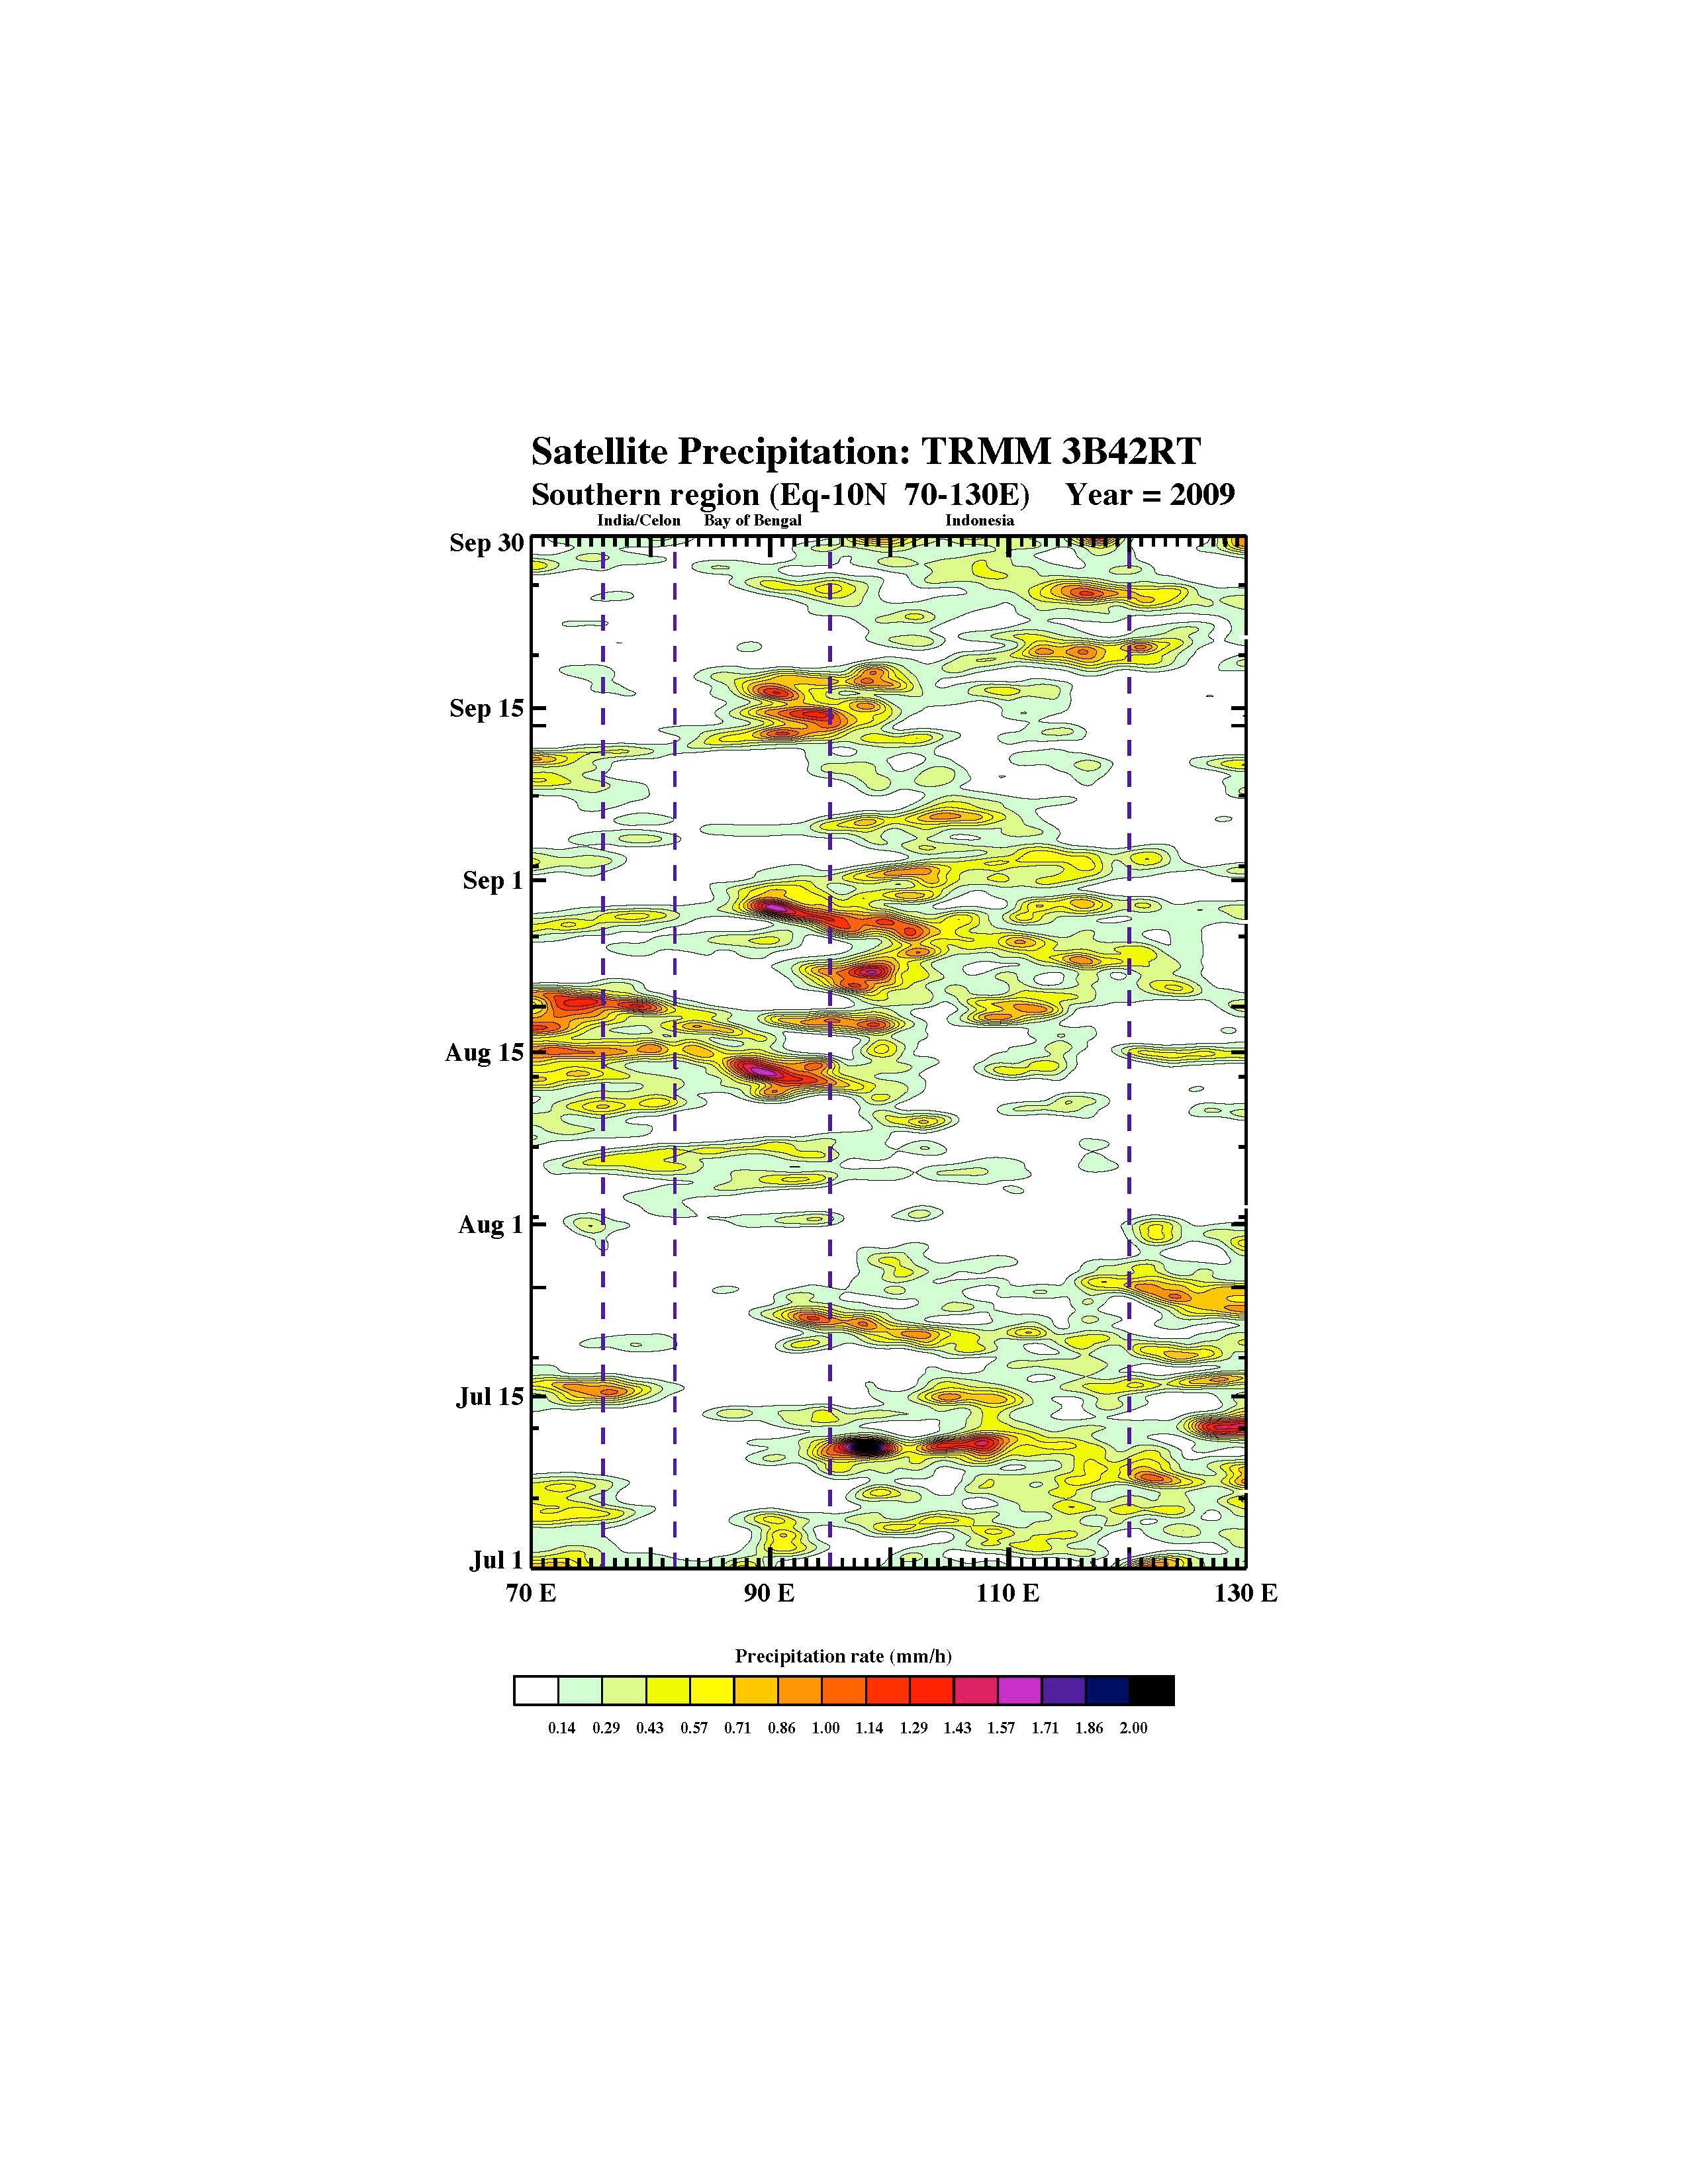
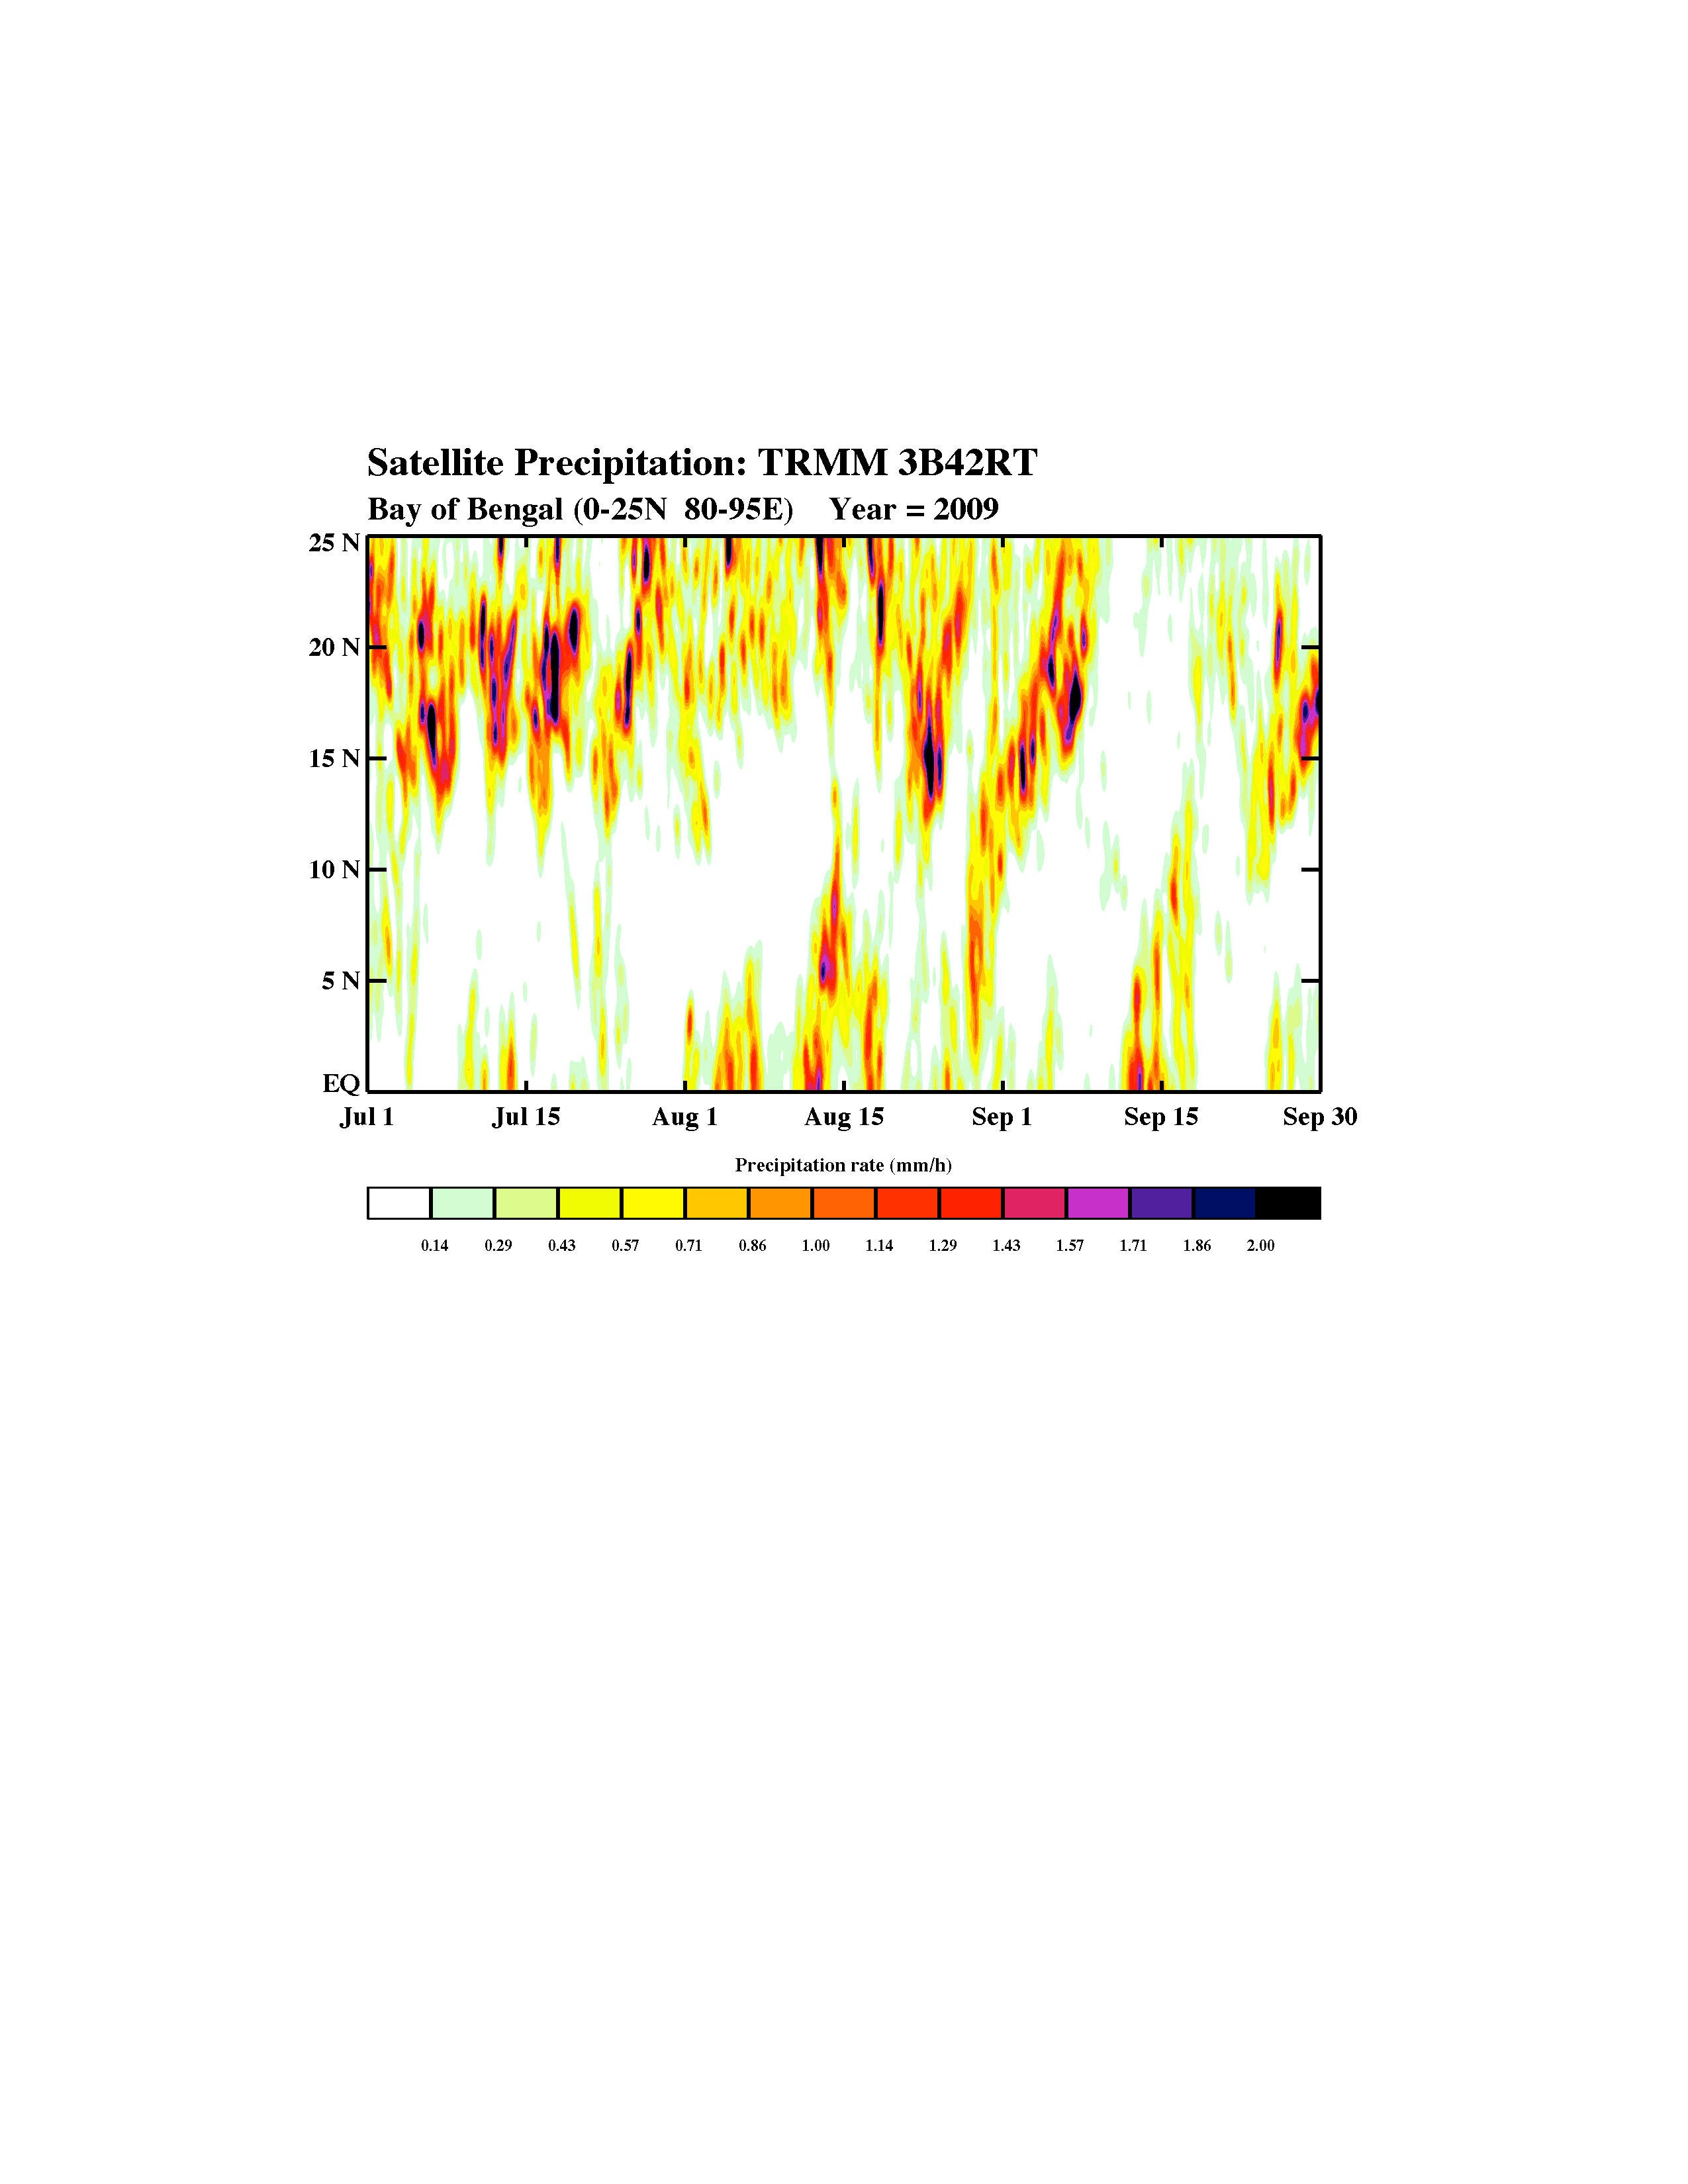
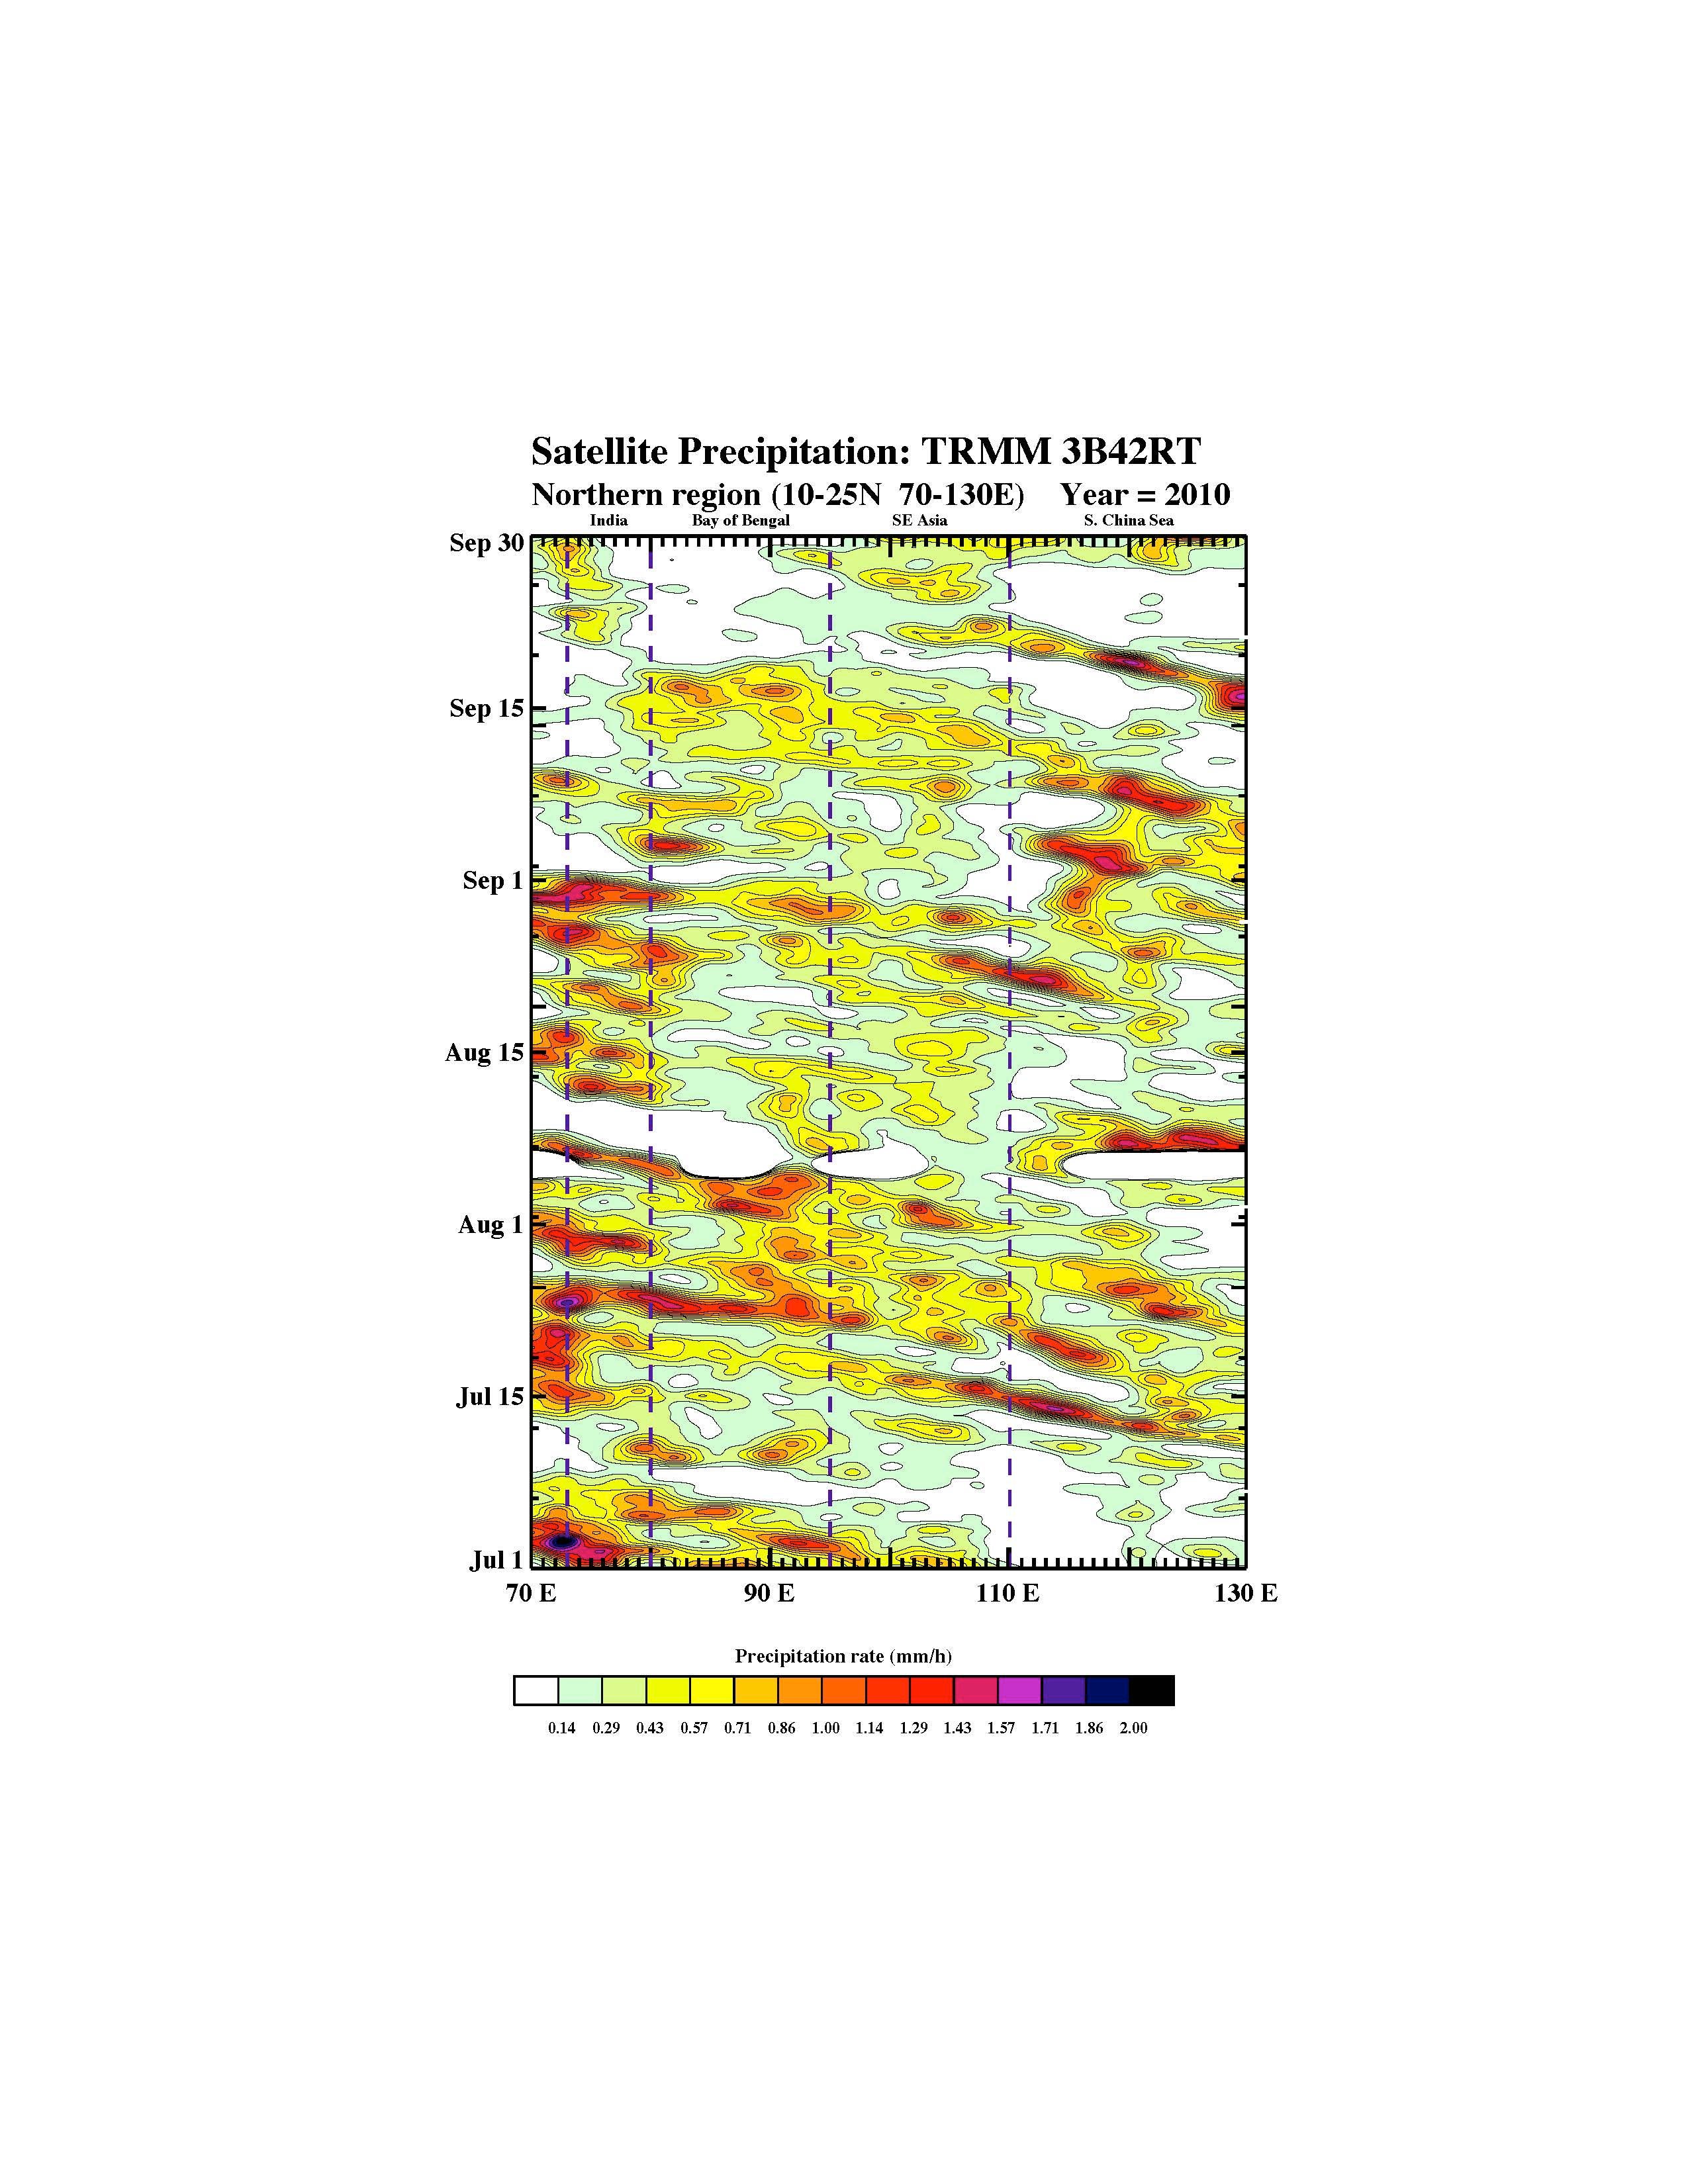
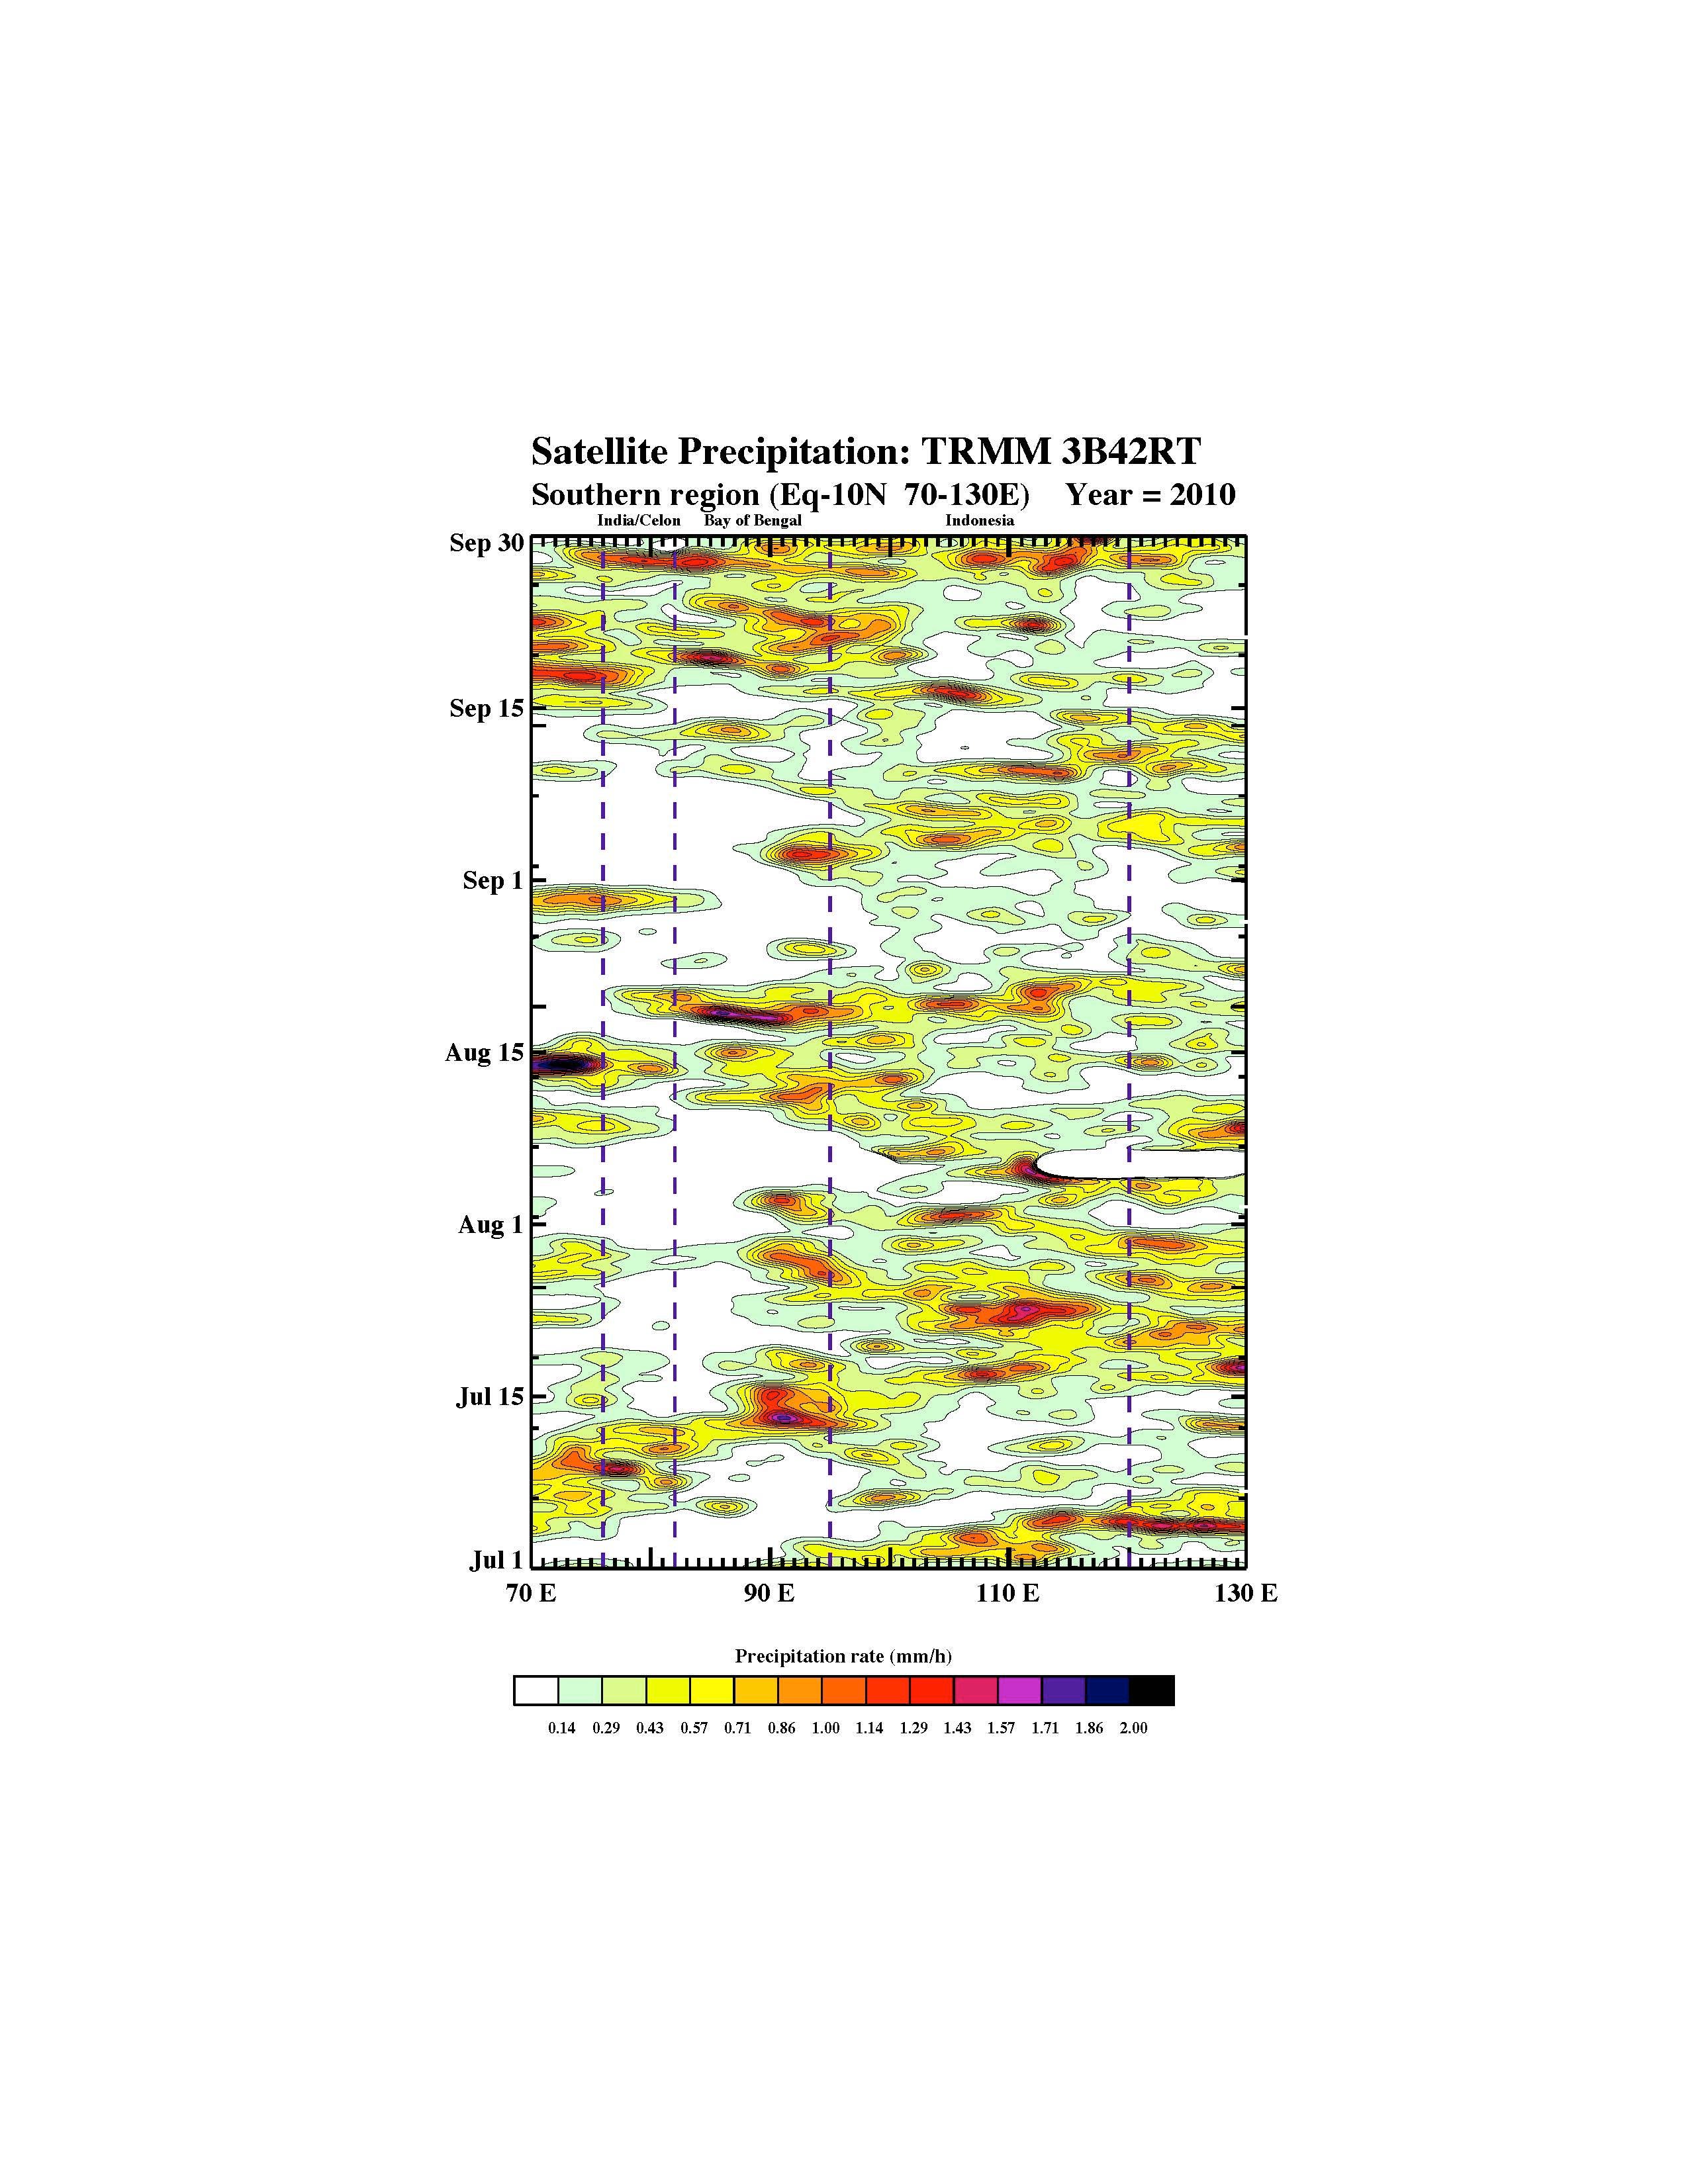
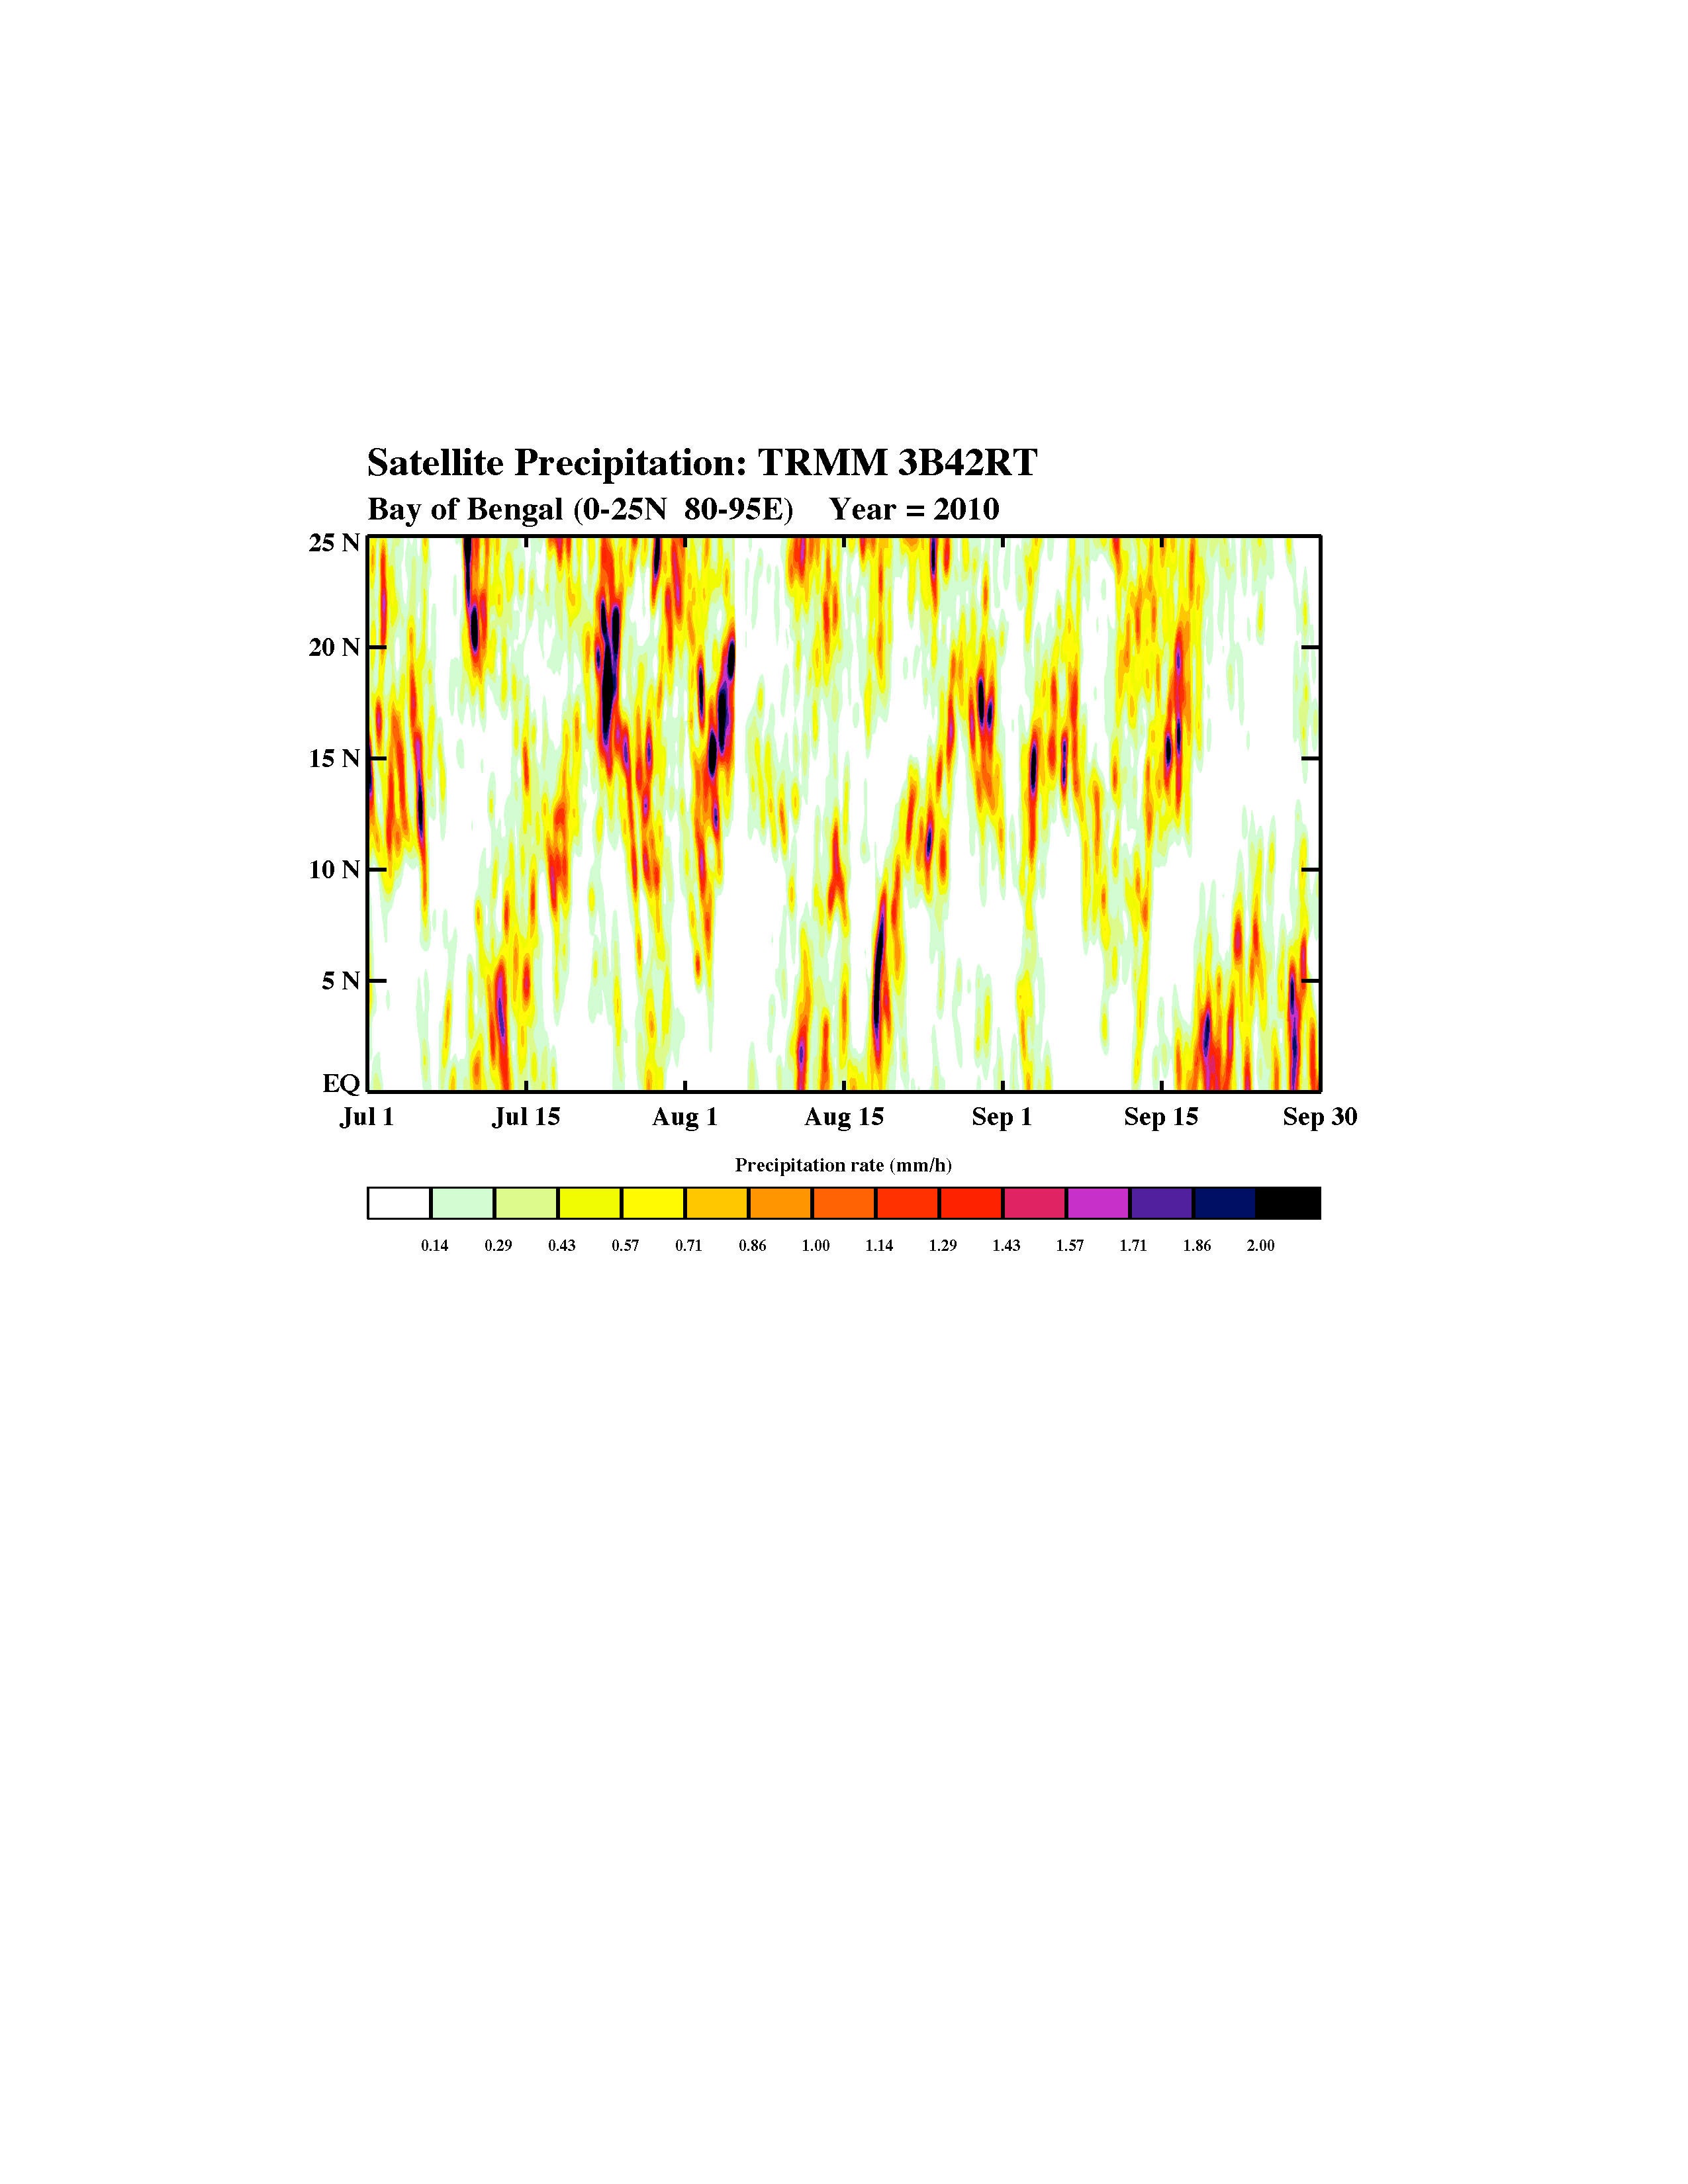
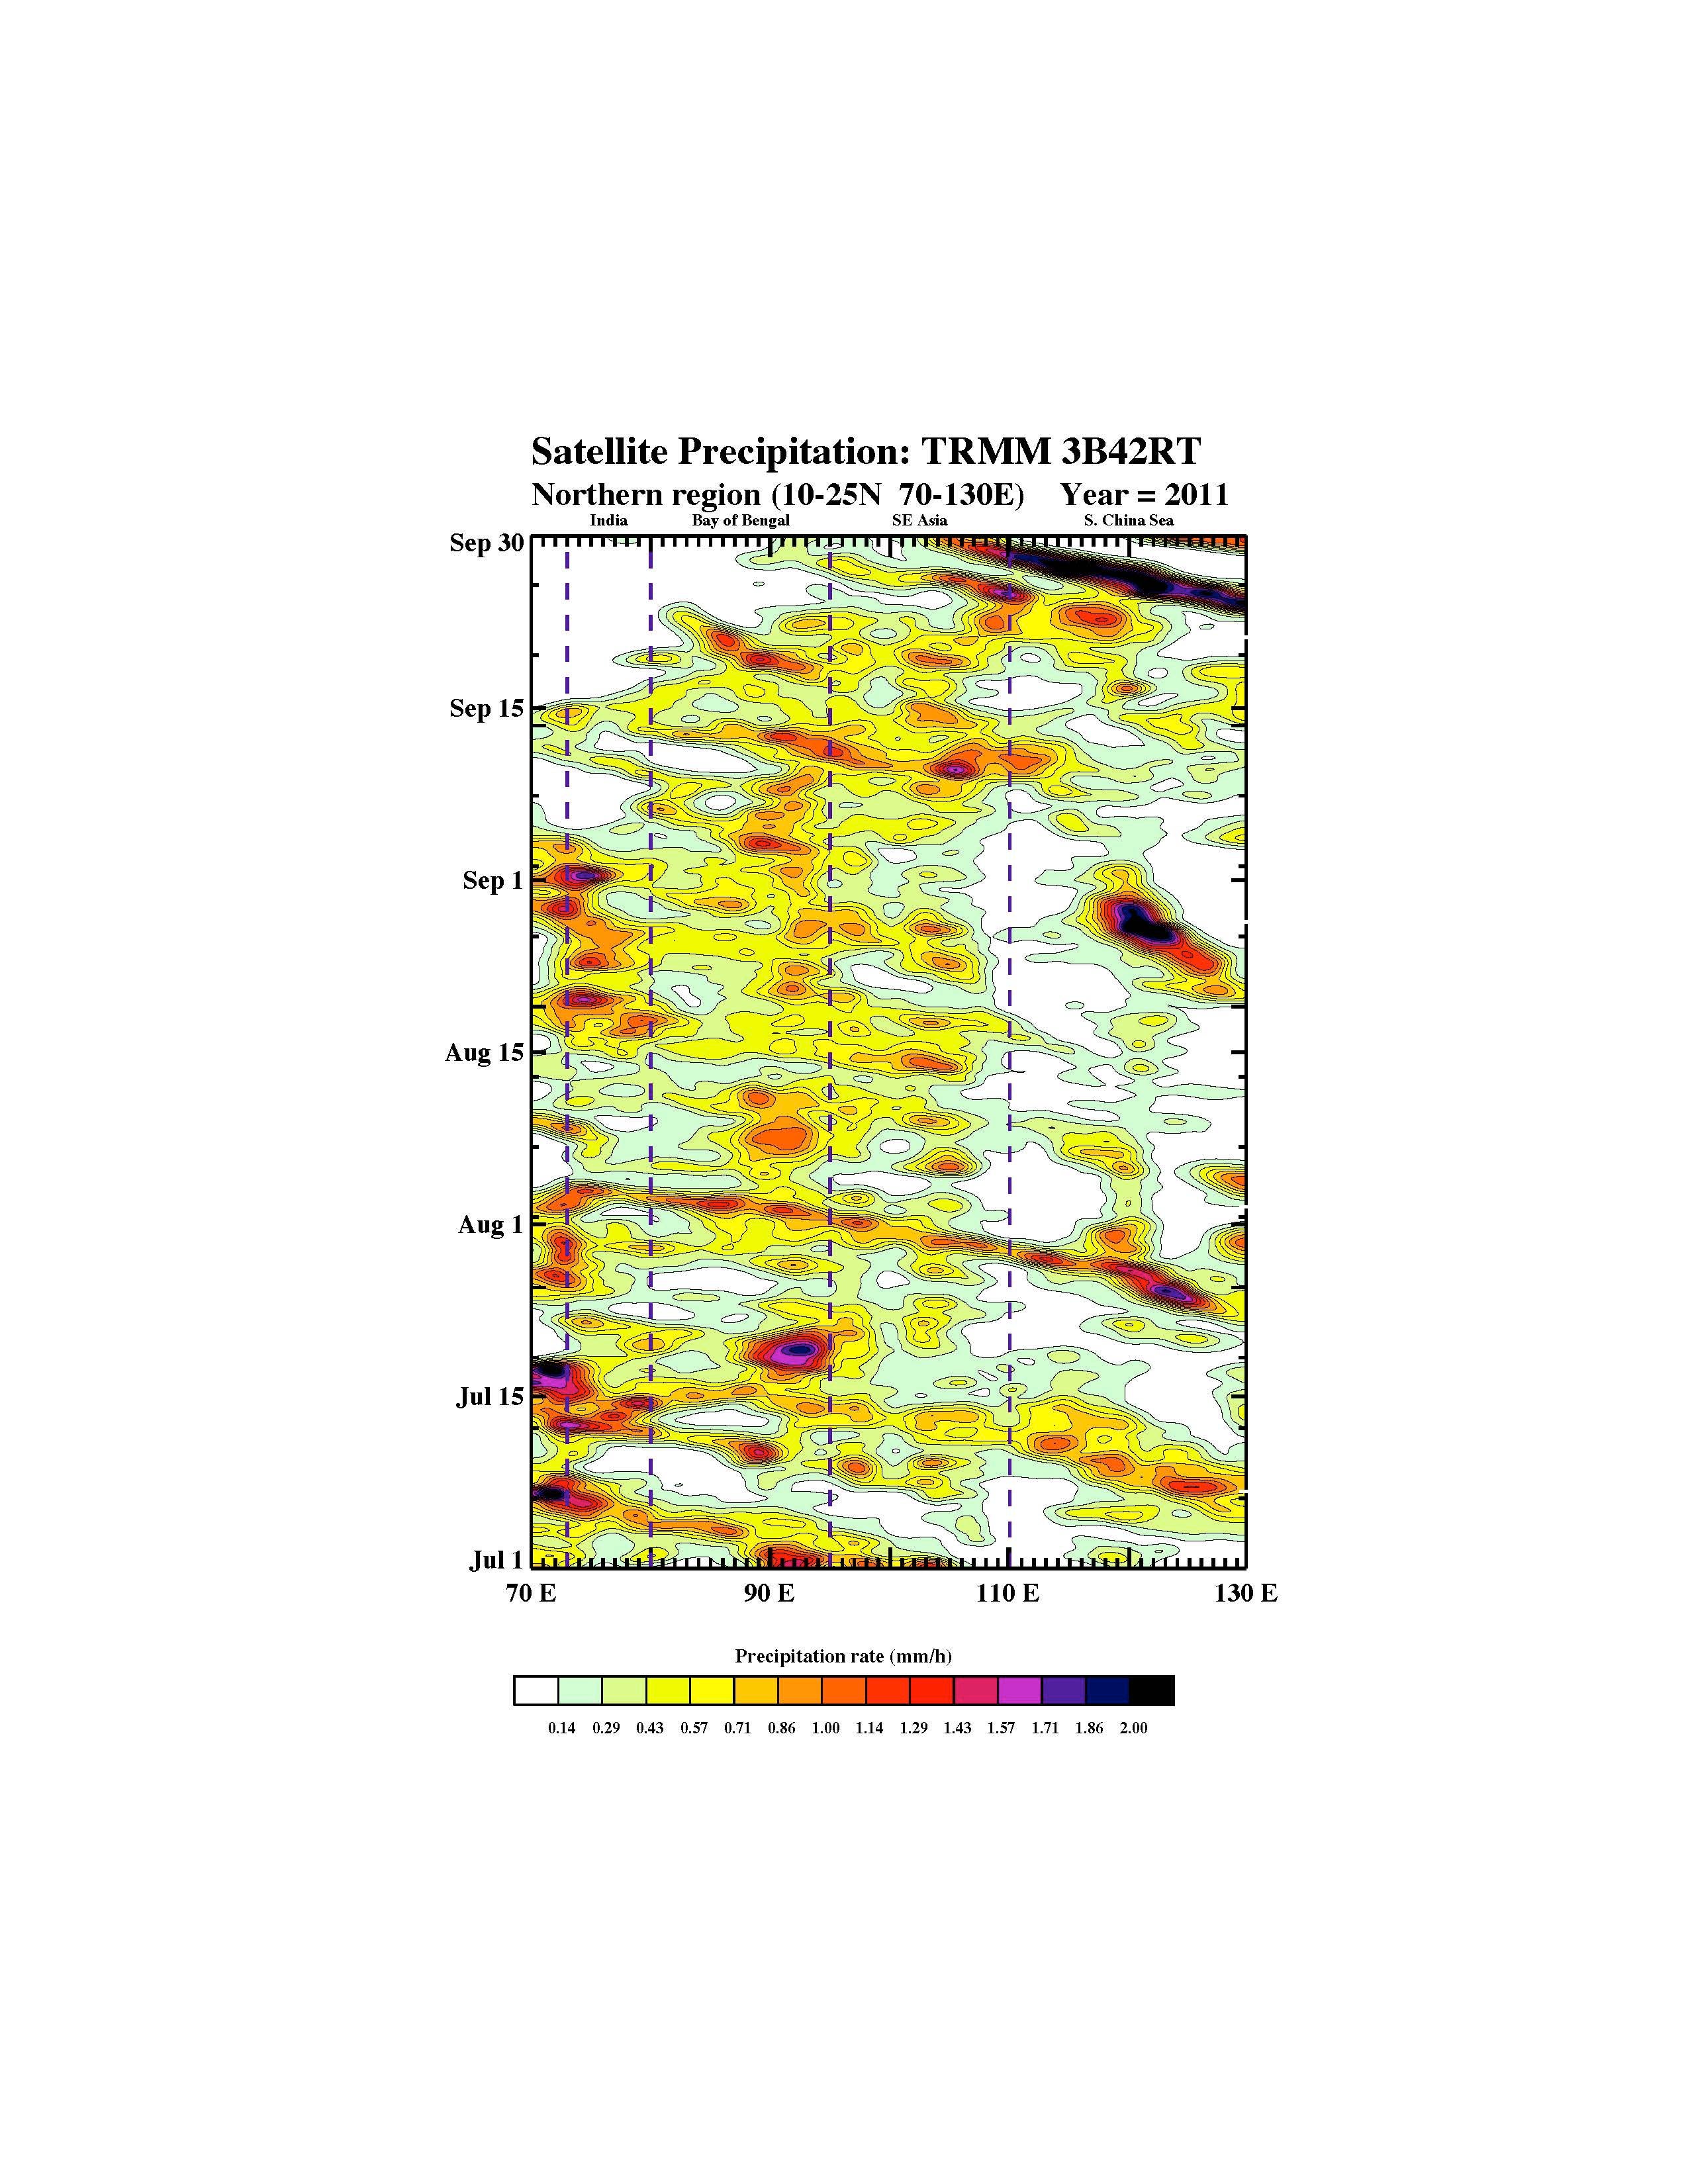
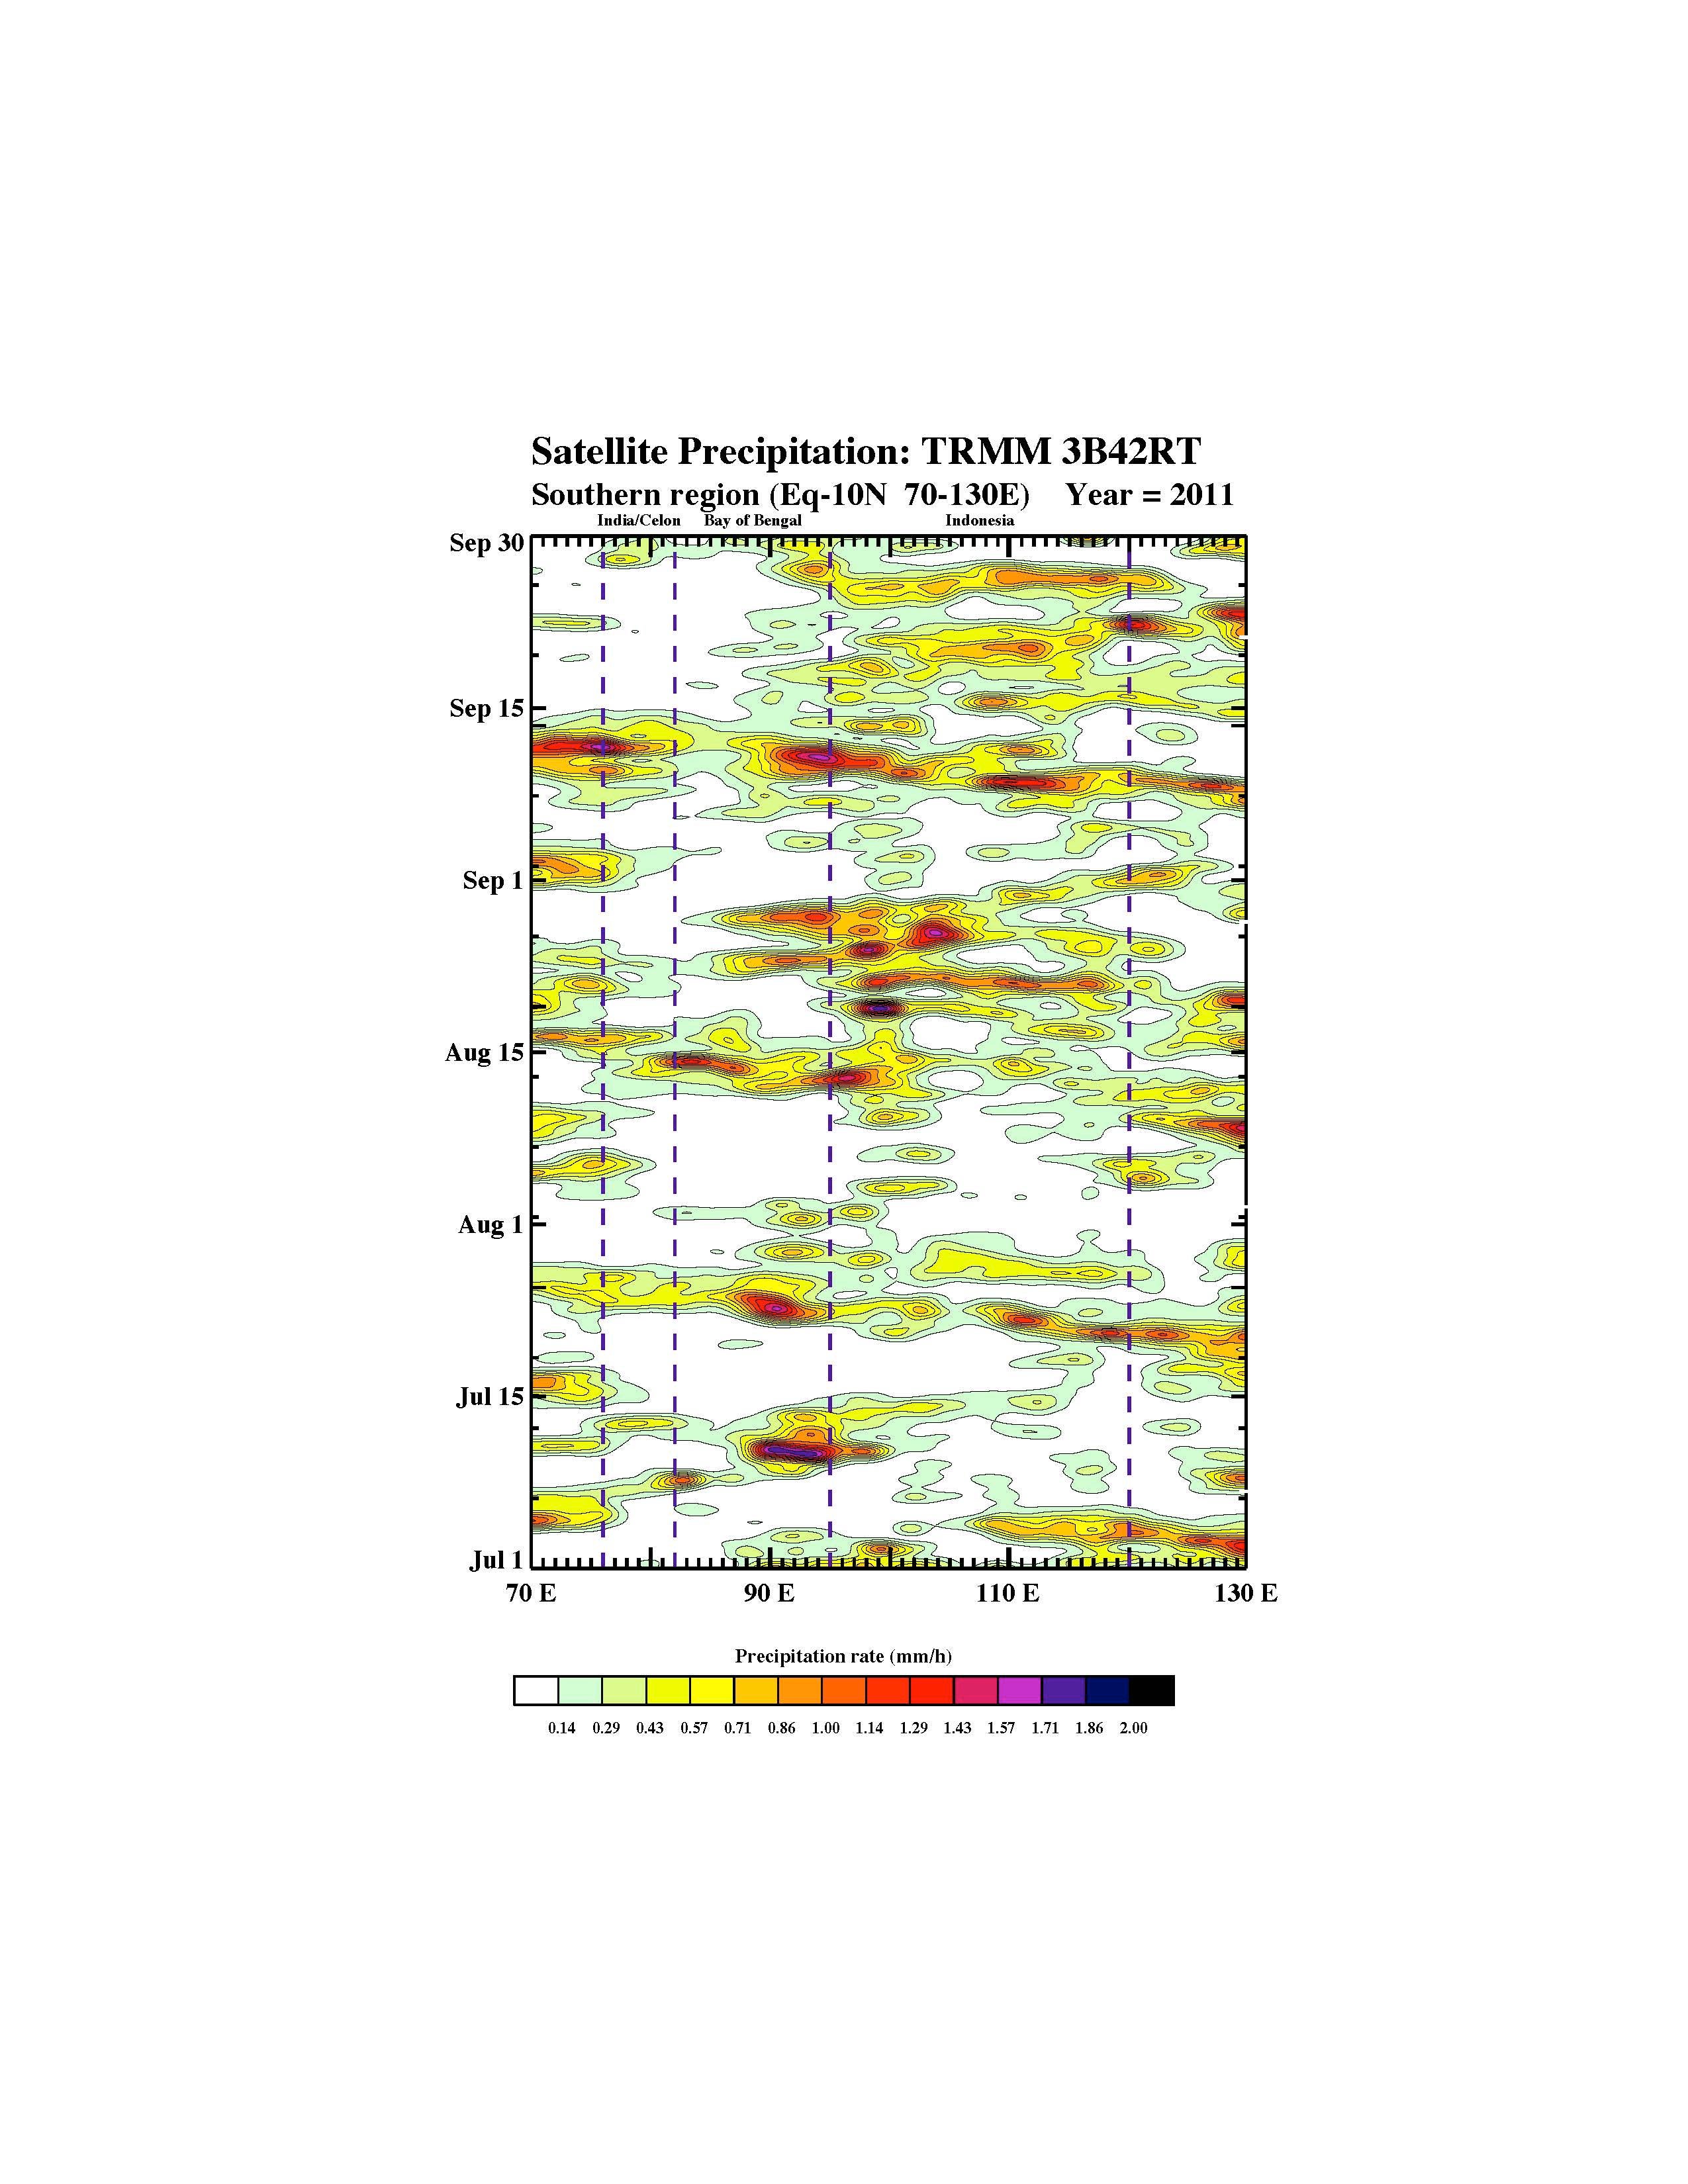
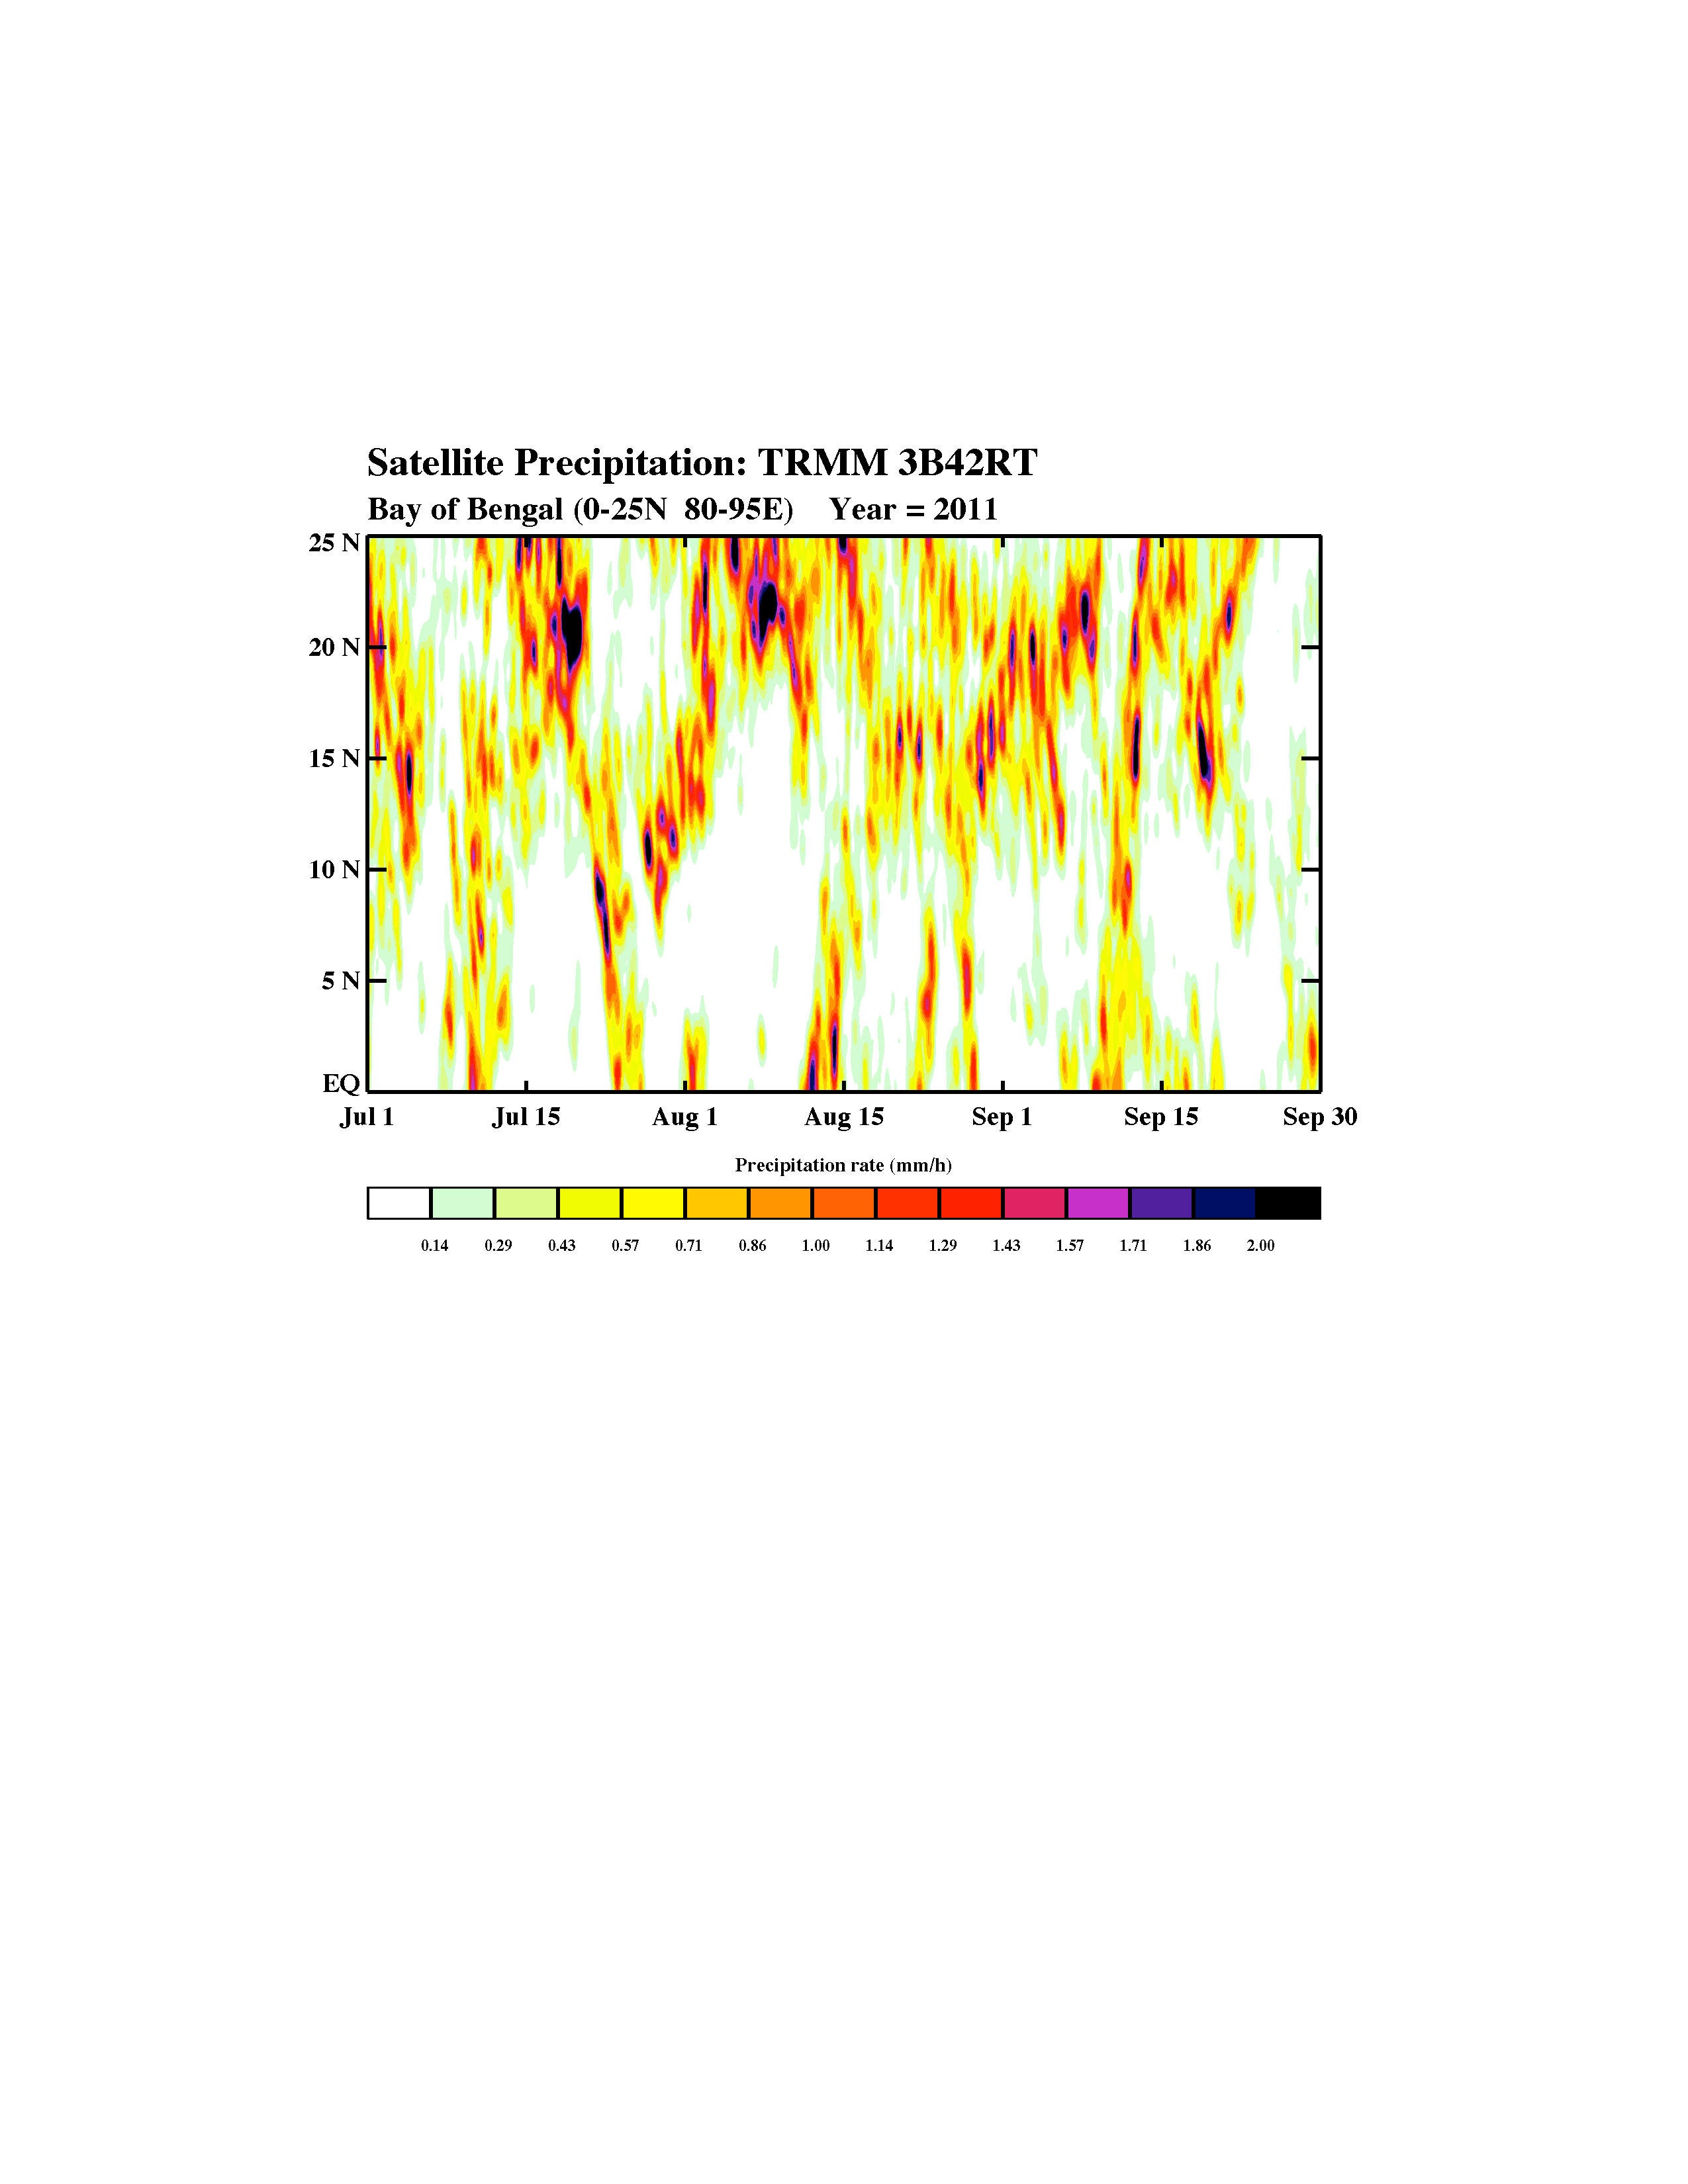
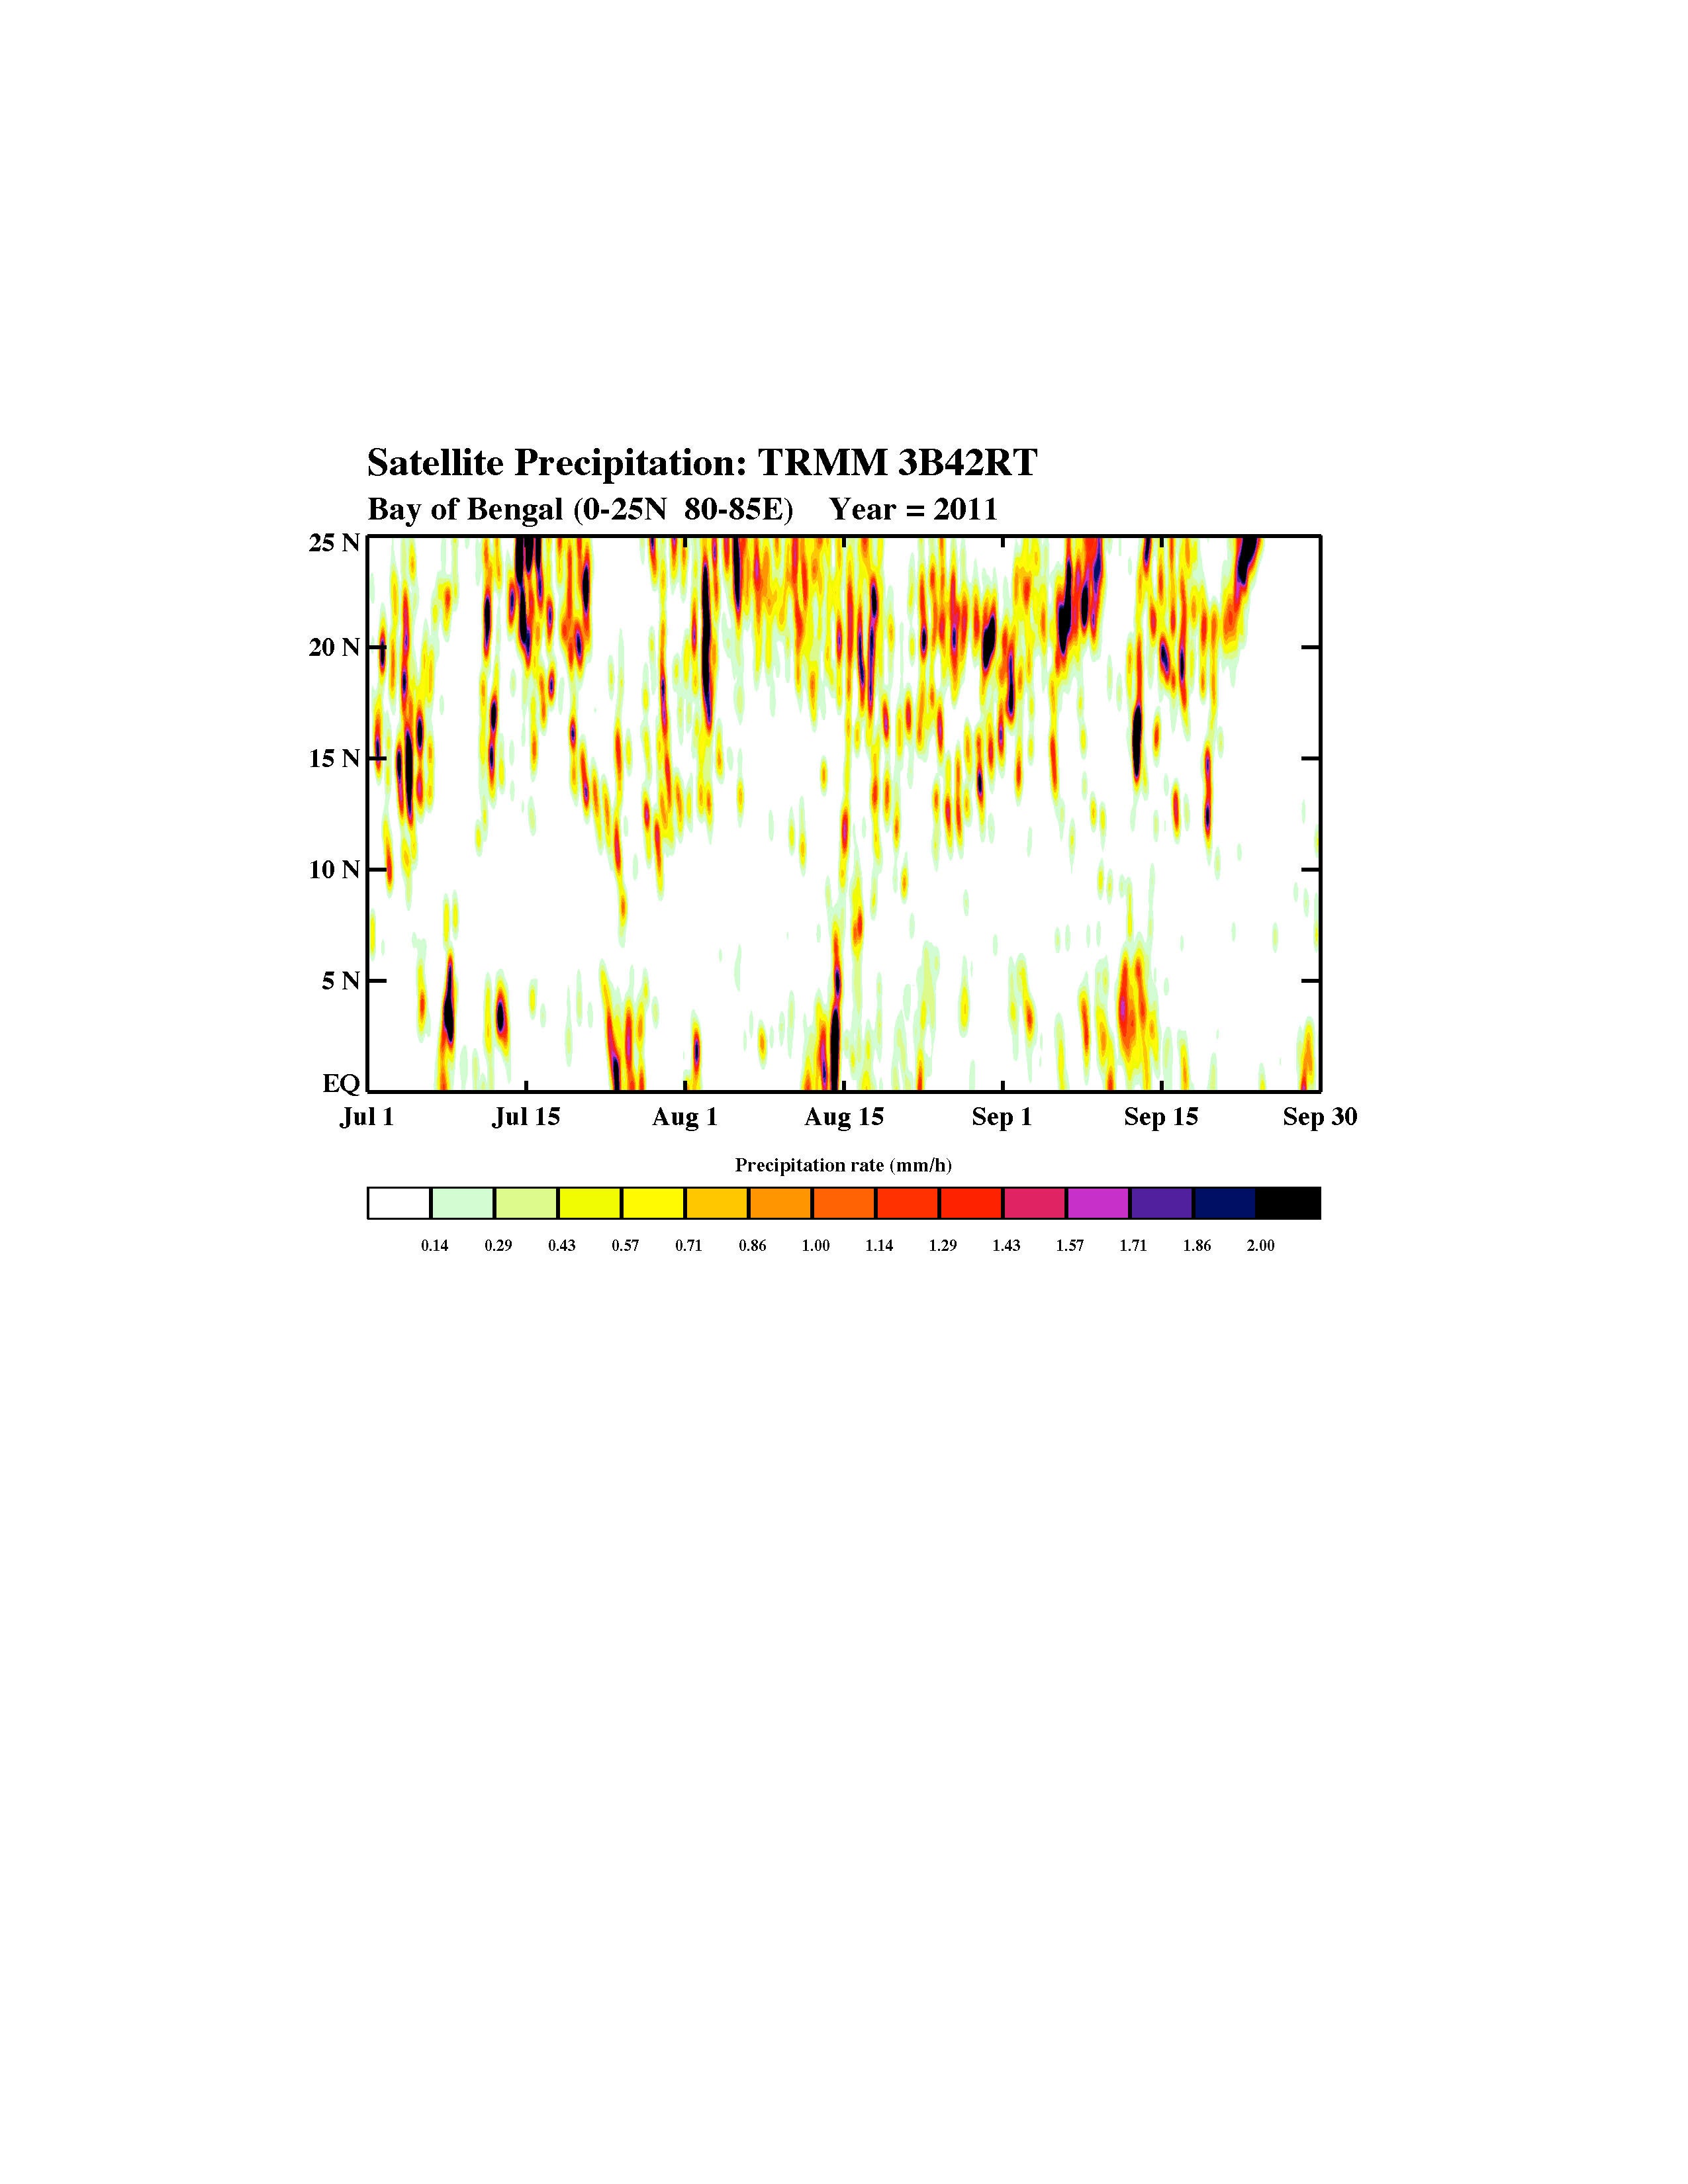
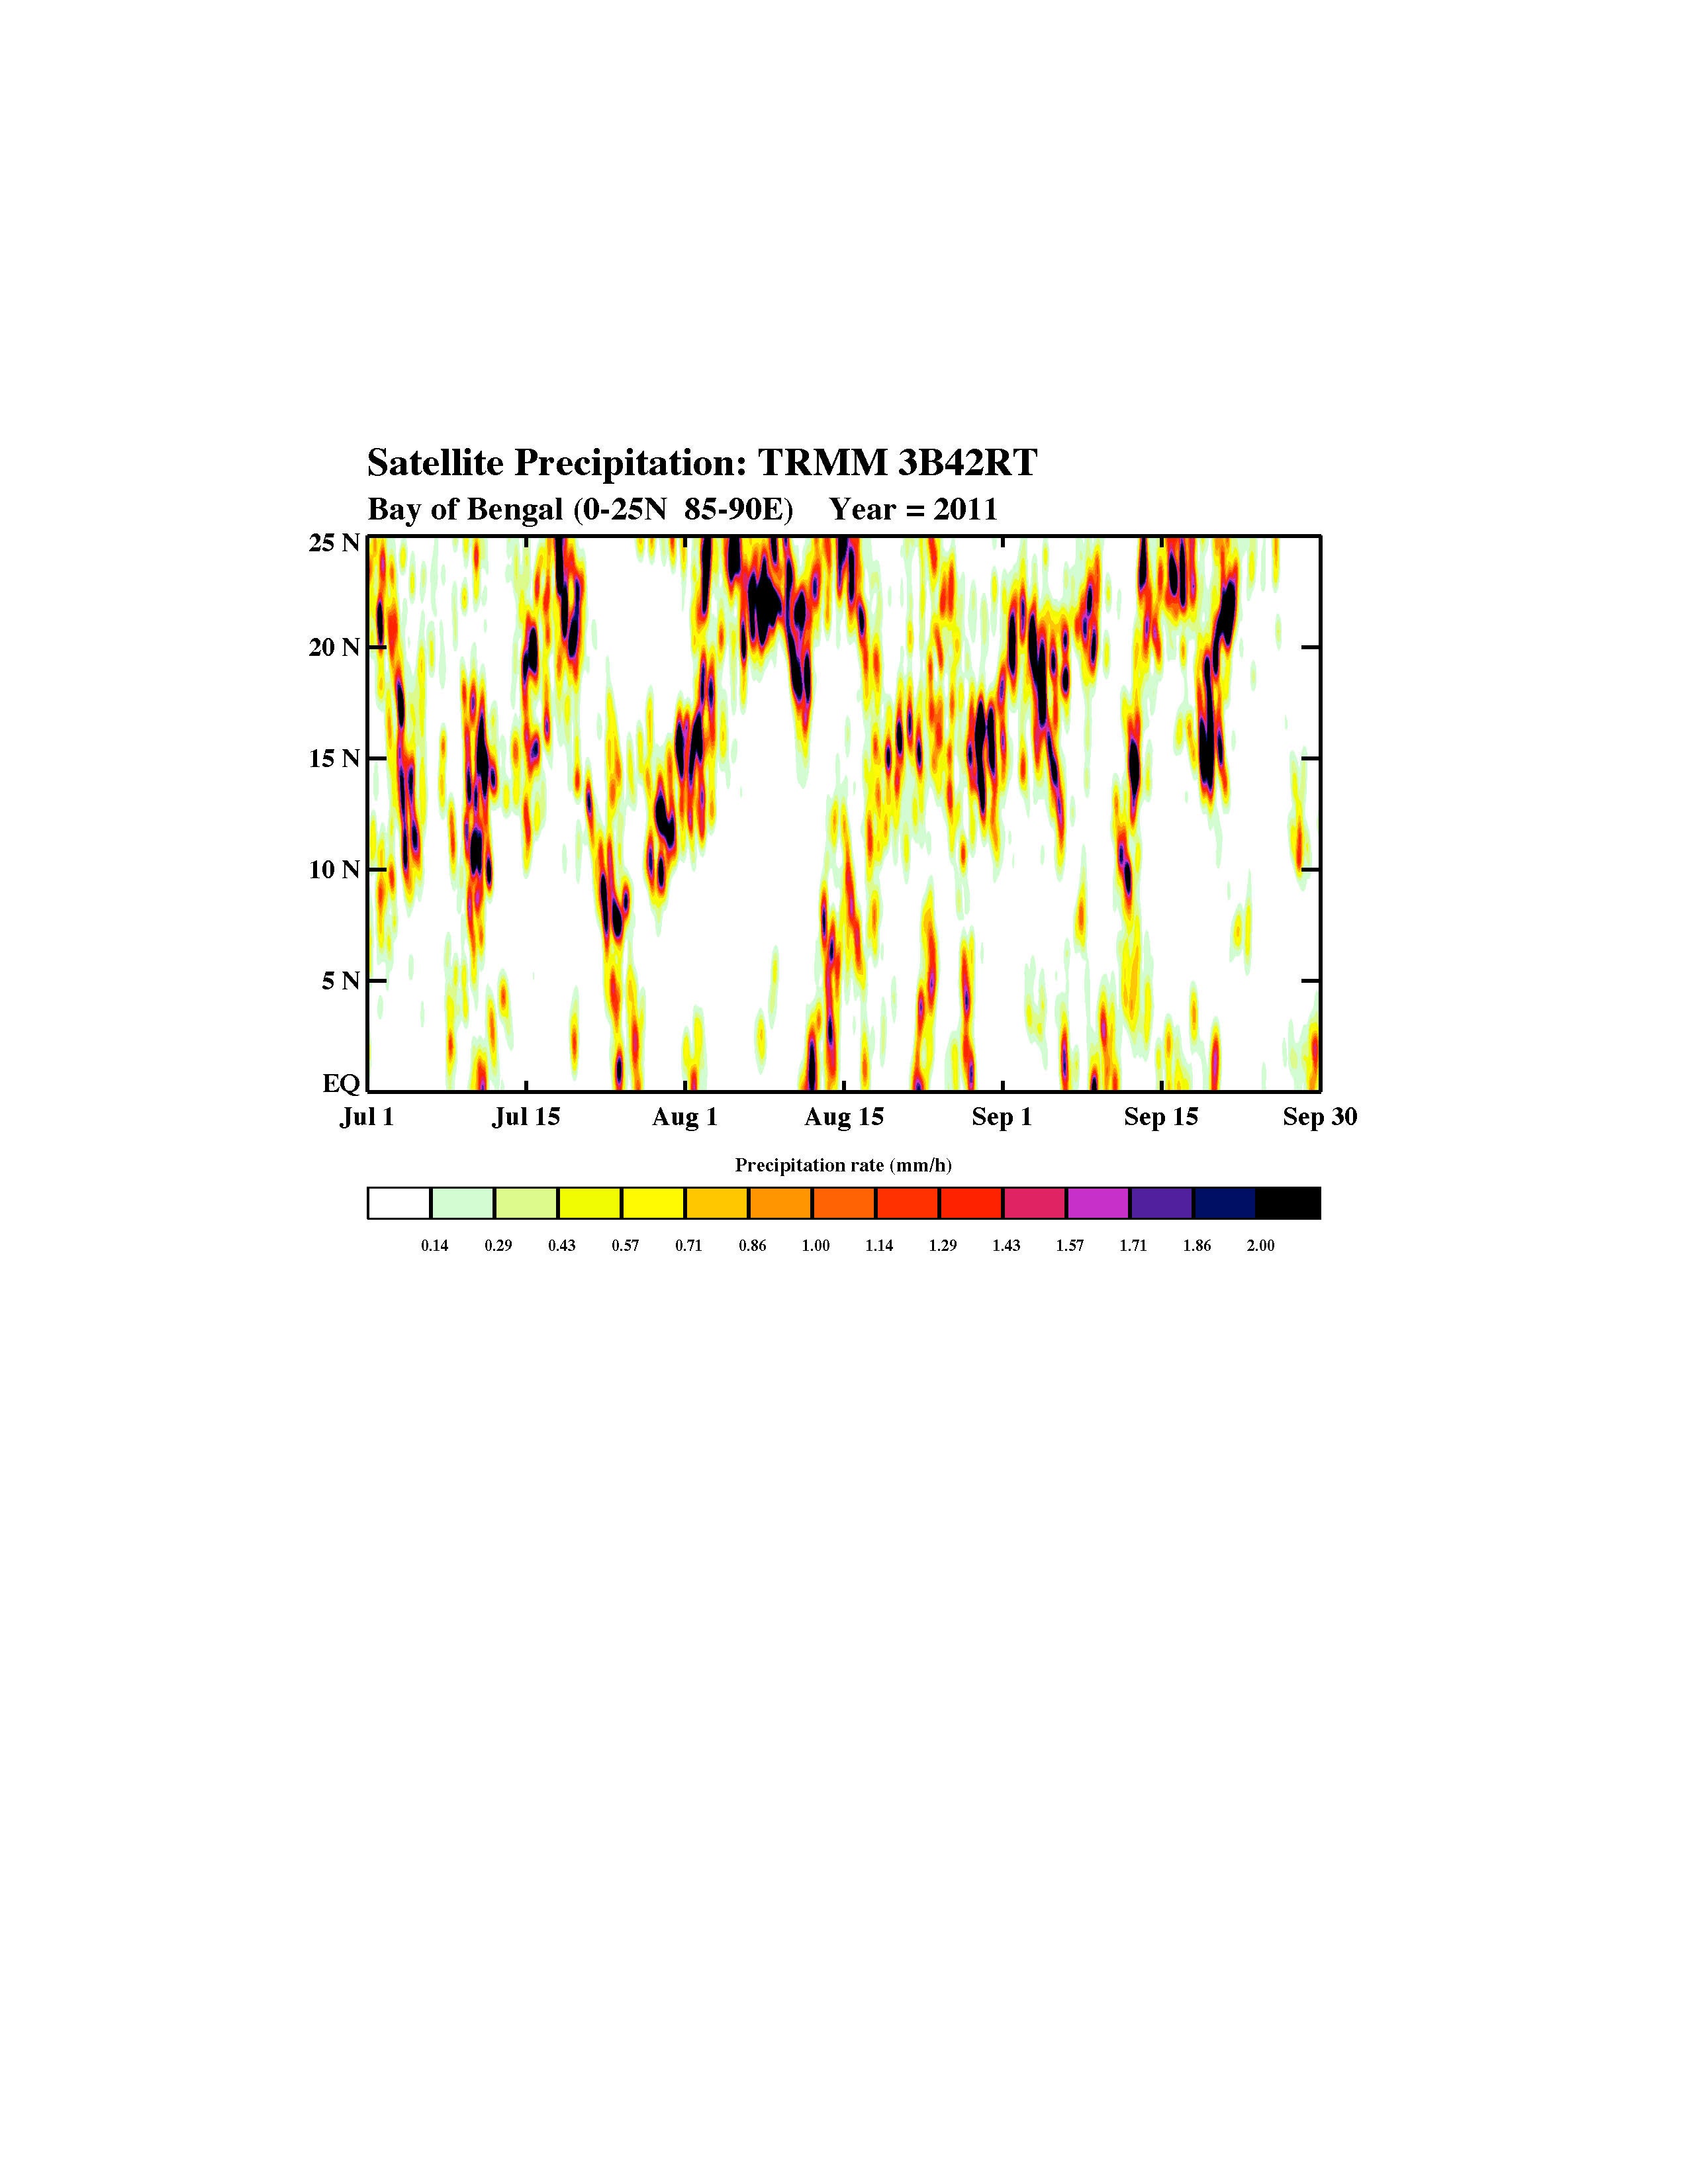
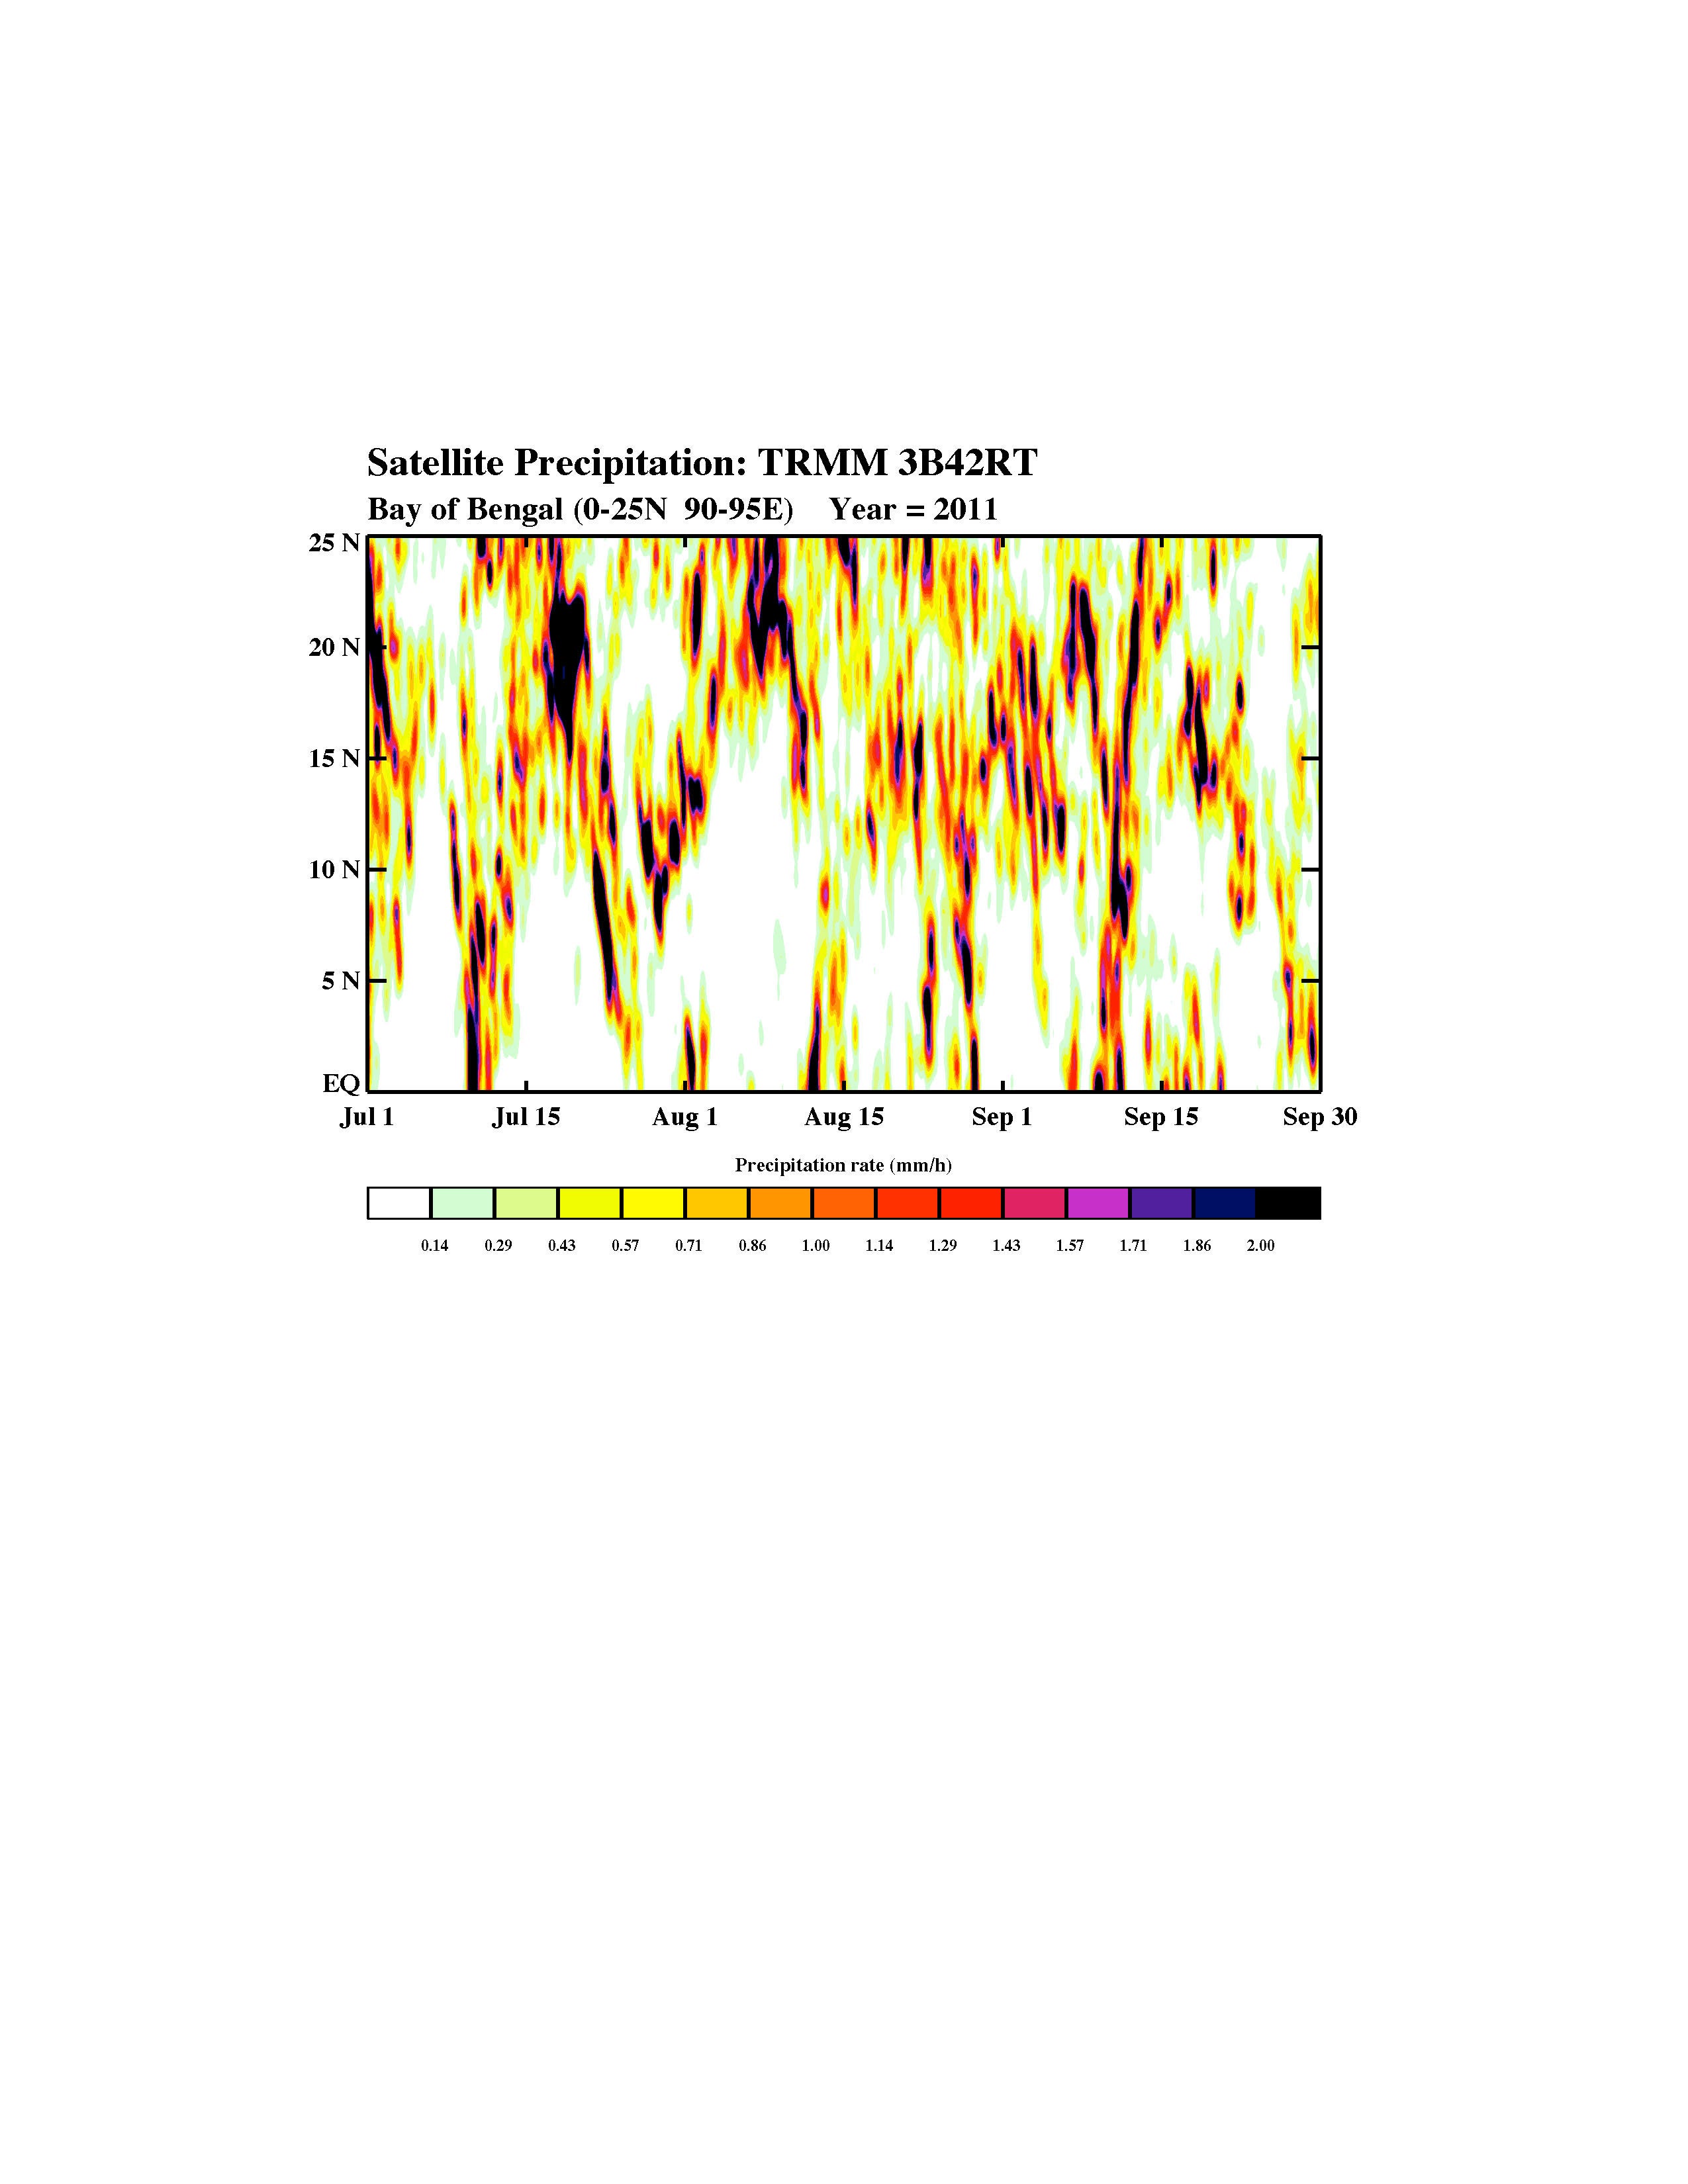
Convection: Hovmoeller diagrams from TRMM data
| 2005: | North | South | Bay of Bengal |
|---|---|---|---|
| 2006: | North | South | Bay of Bengal |
| 2007: | North | South | Bay of Bengal |
| 2008: | North | South | Bay of Bengal |
| 2009: | North | South | Bay of Bengal |
| 2010: | North | South | Bay of Bengal |
| 2011: | North | South | Bengal, 80-85E, 85-90E, 90-95E |
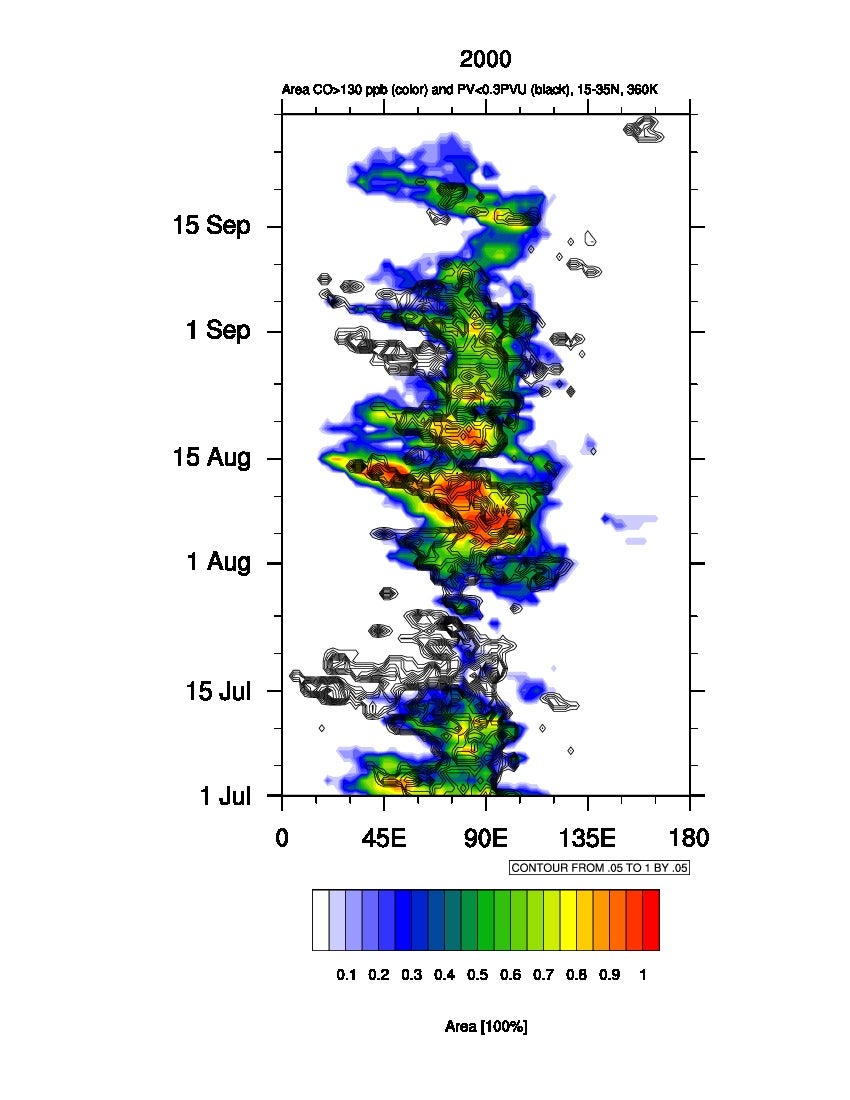
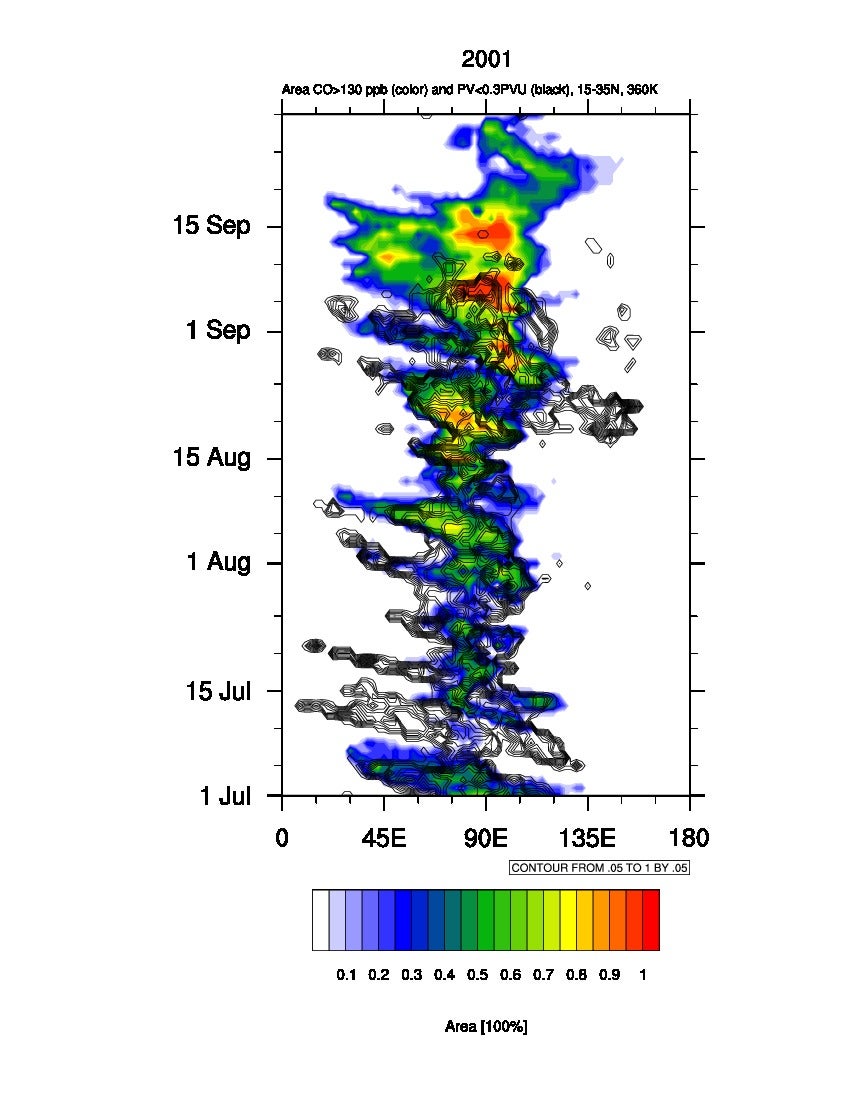
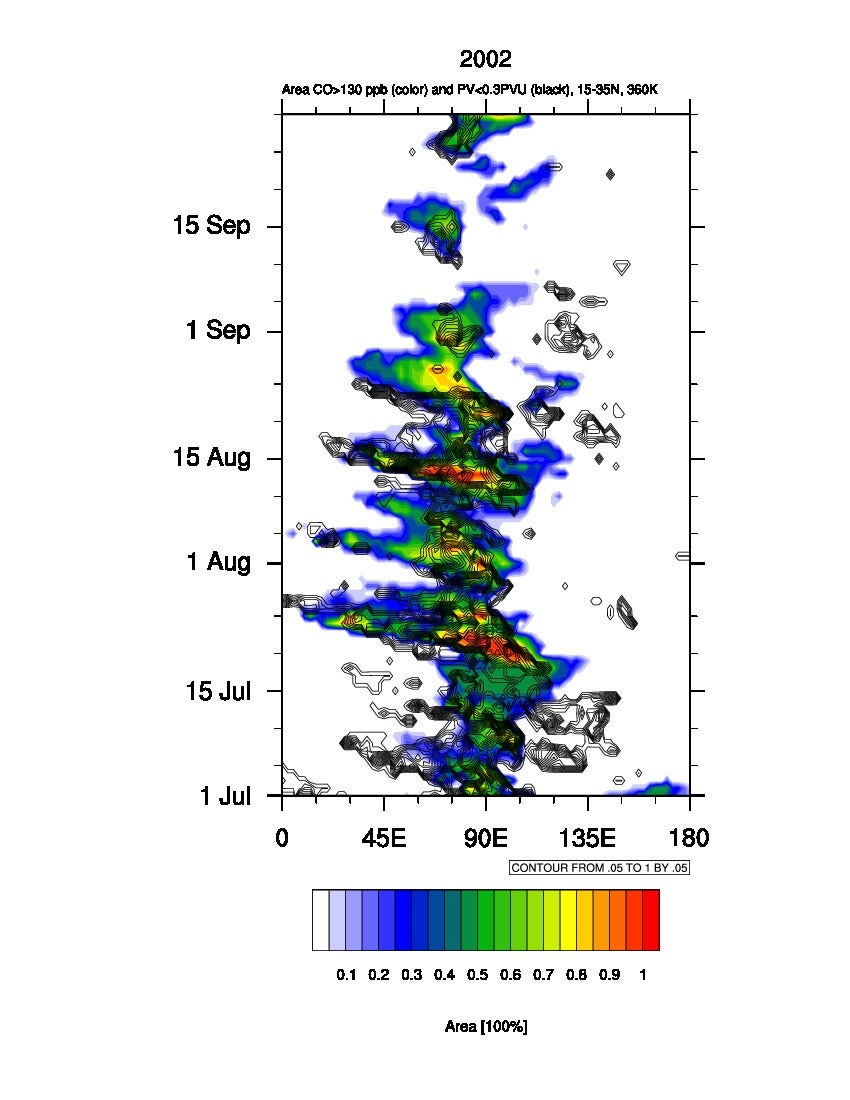
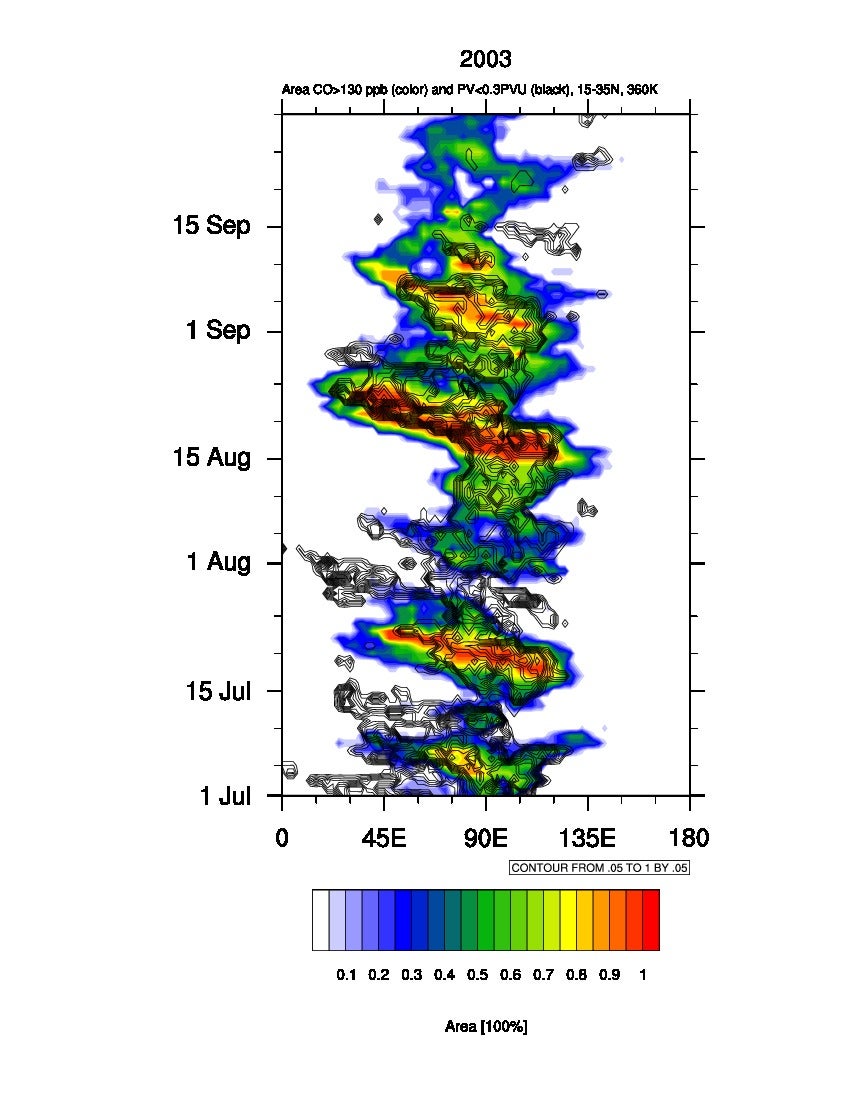
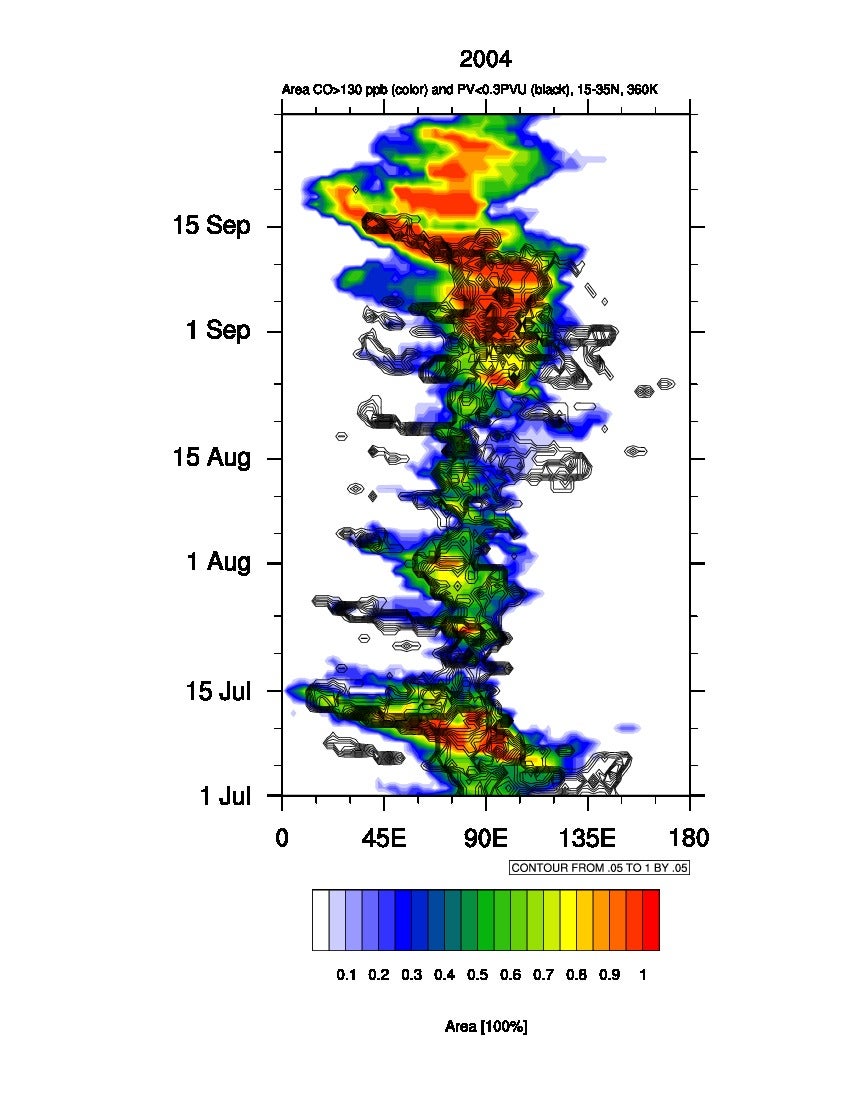
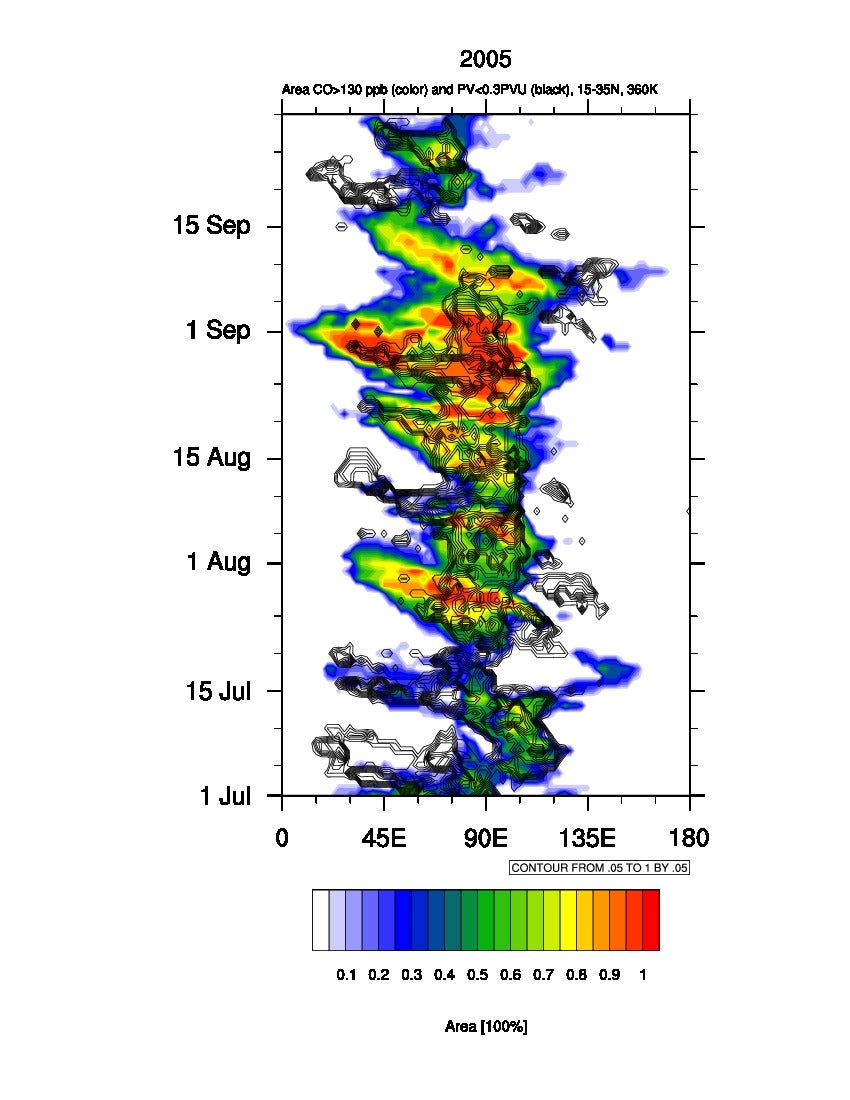
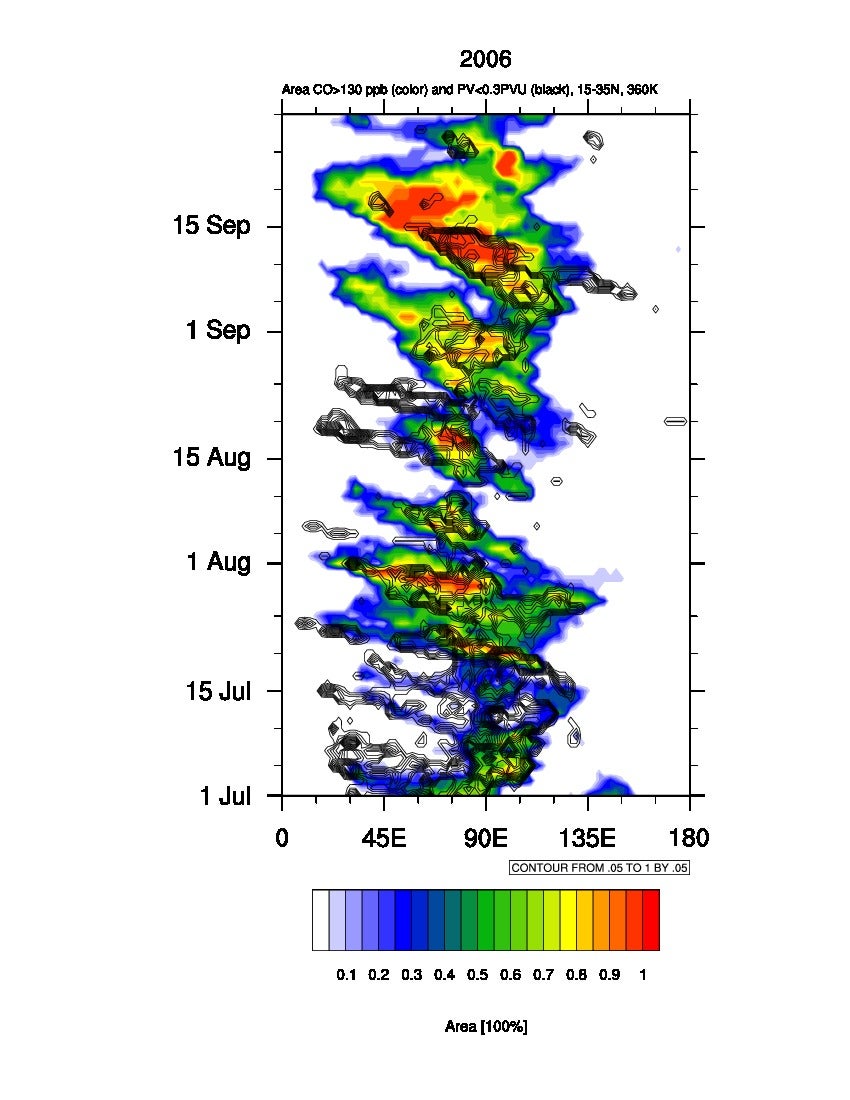
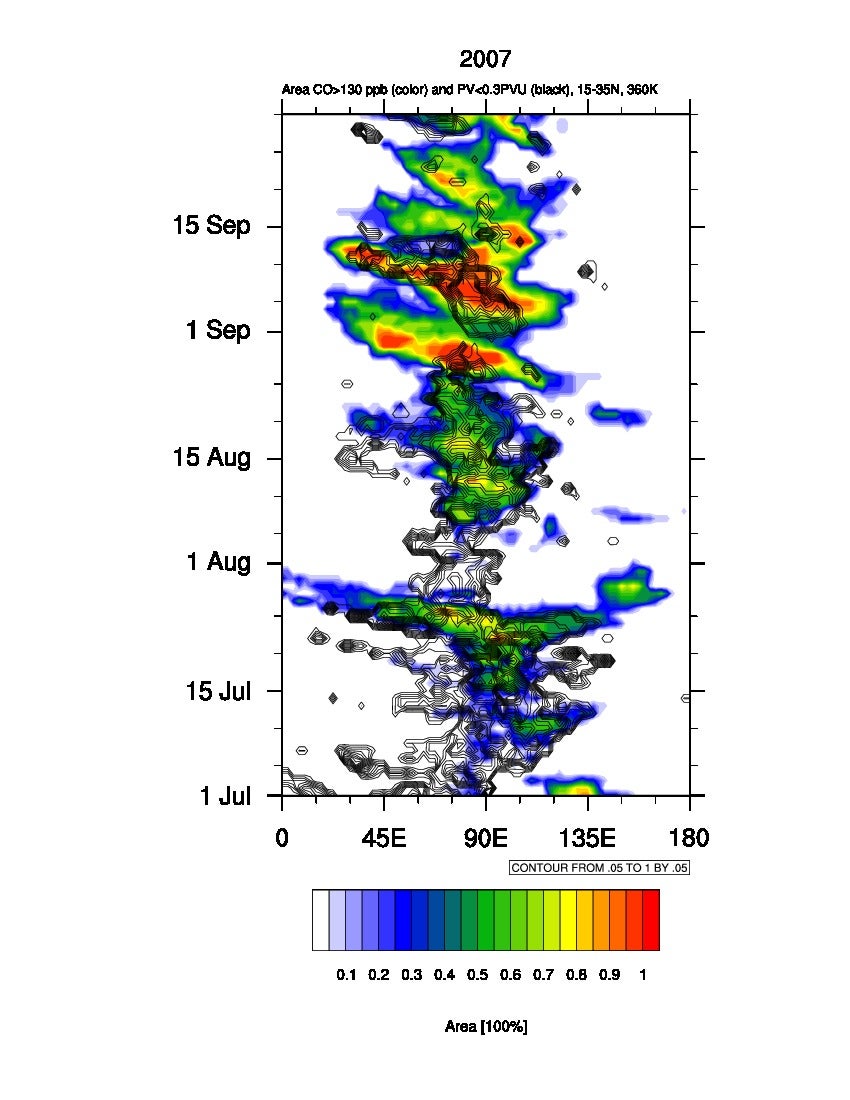
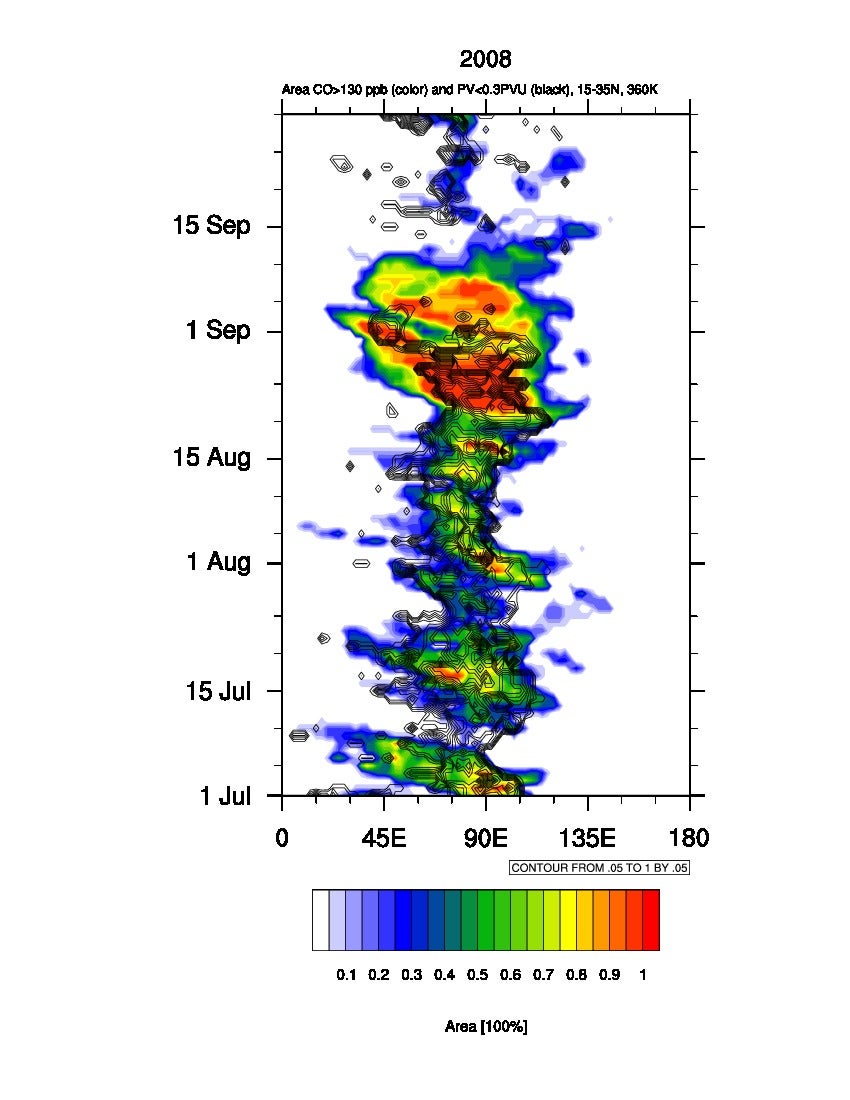
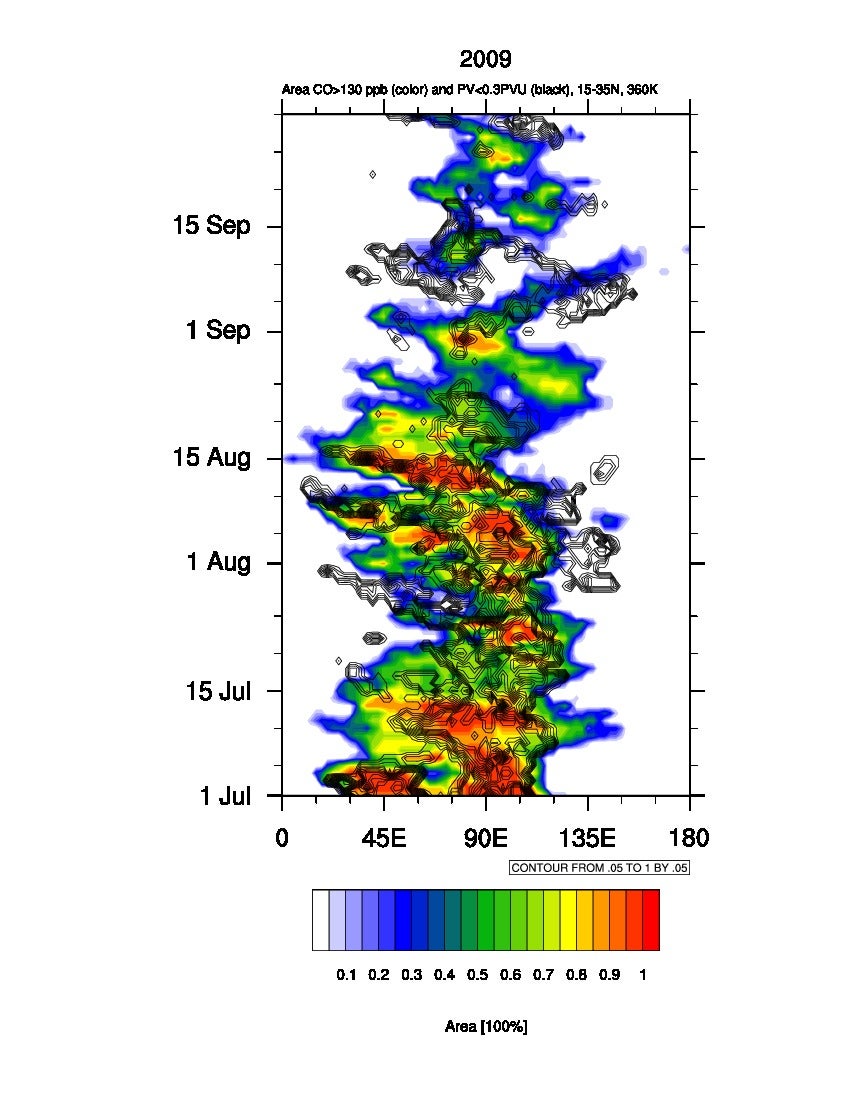
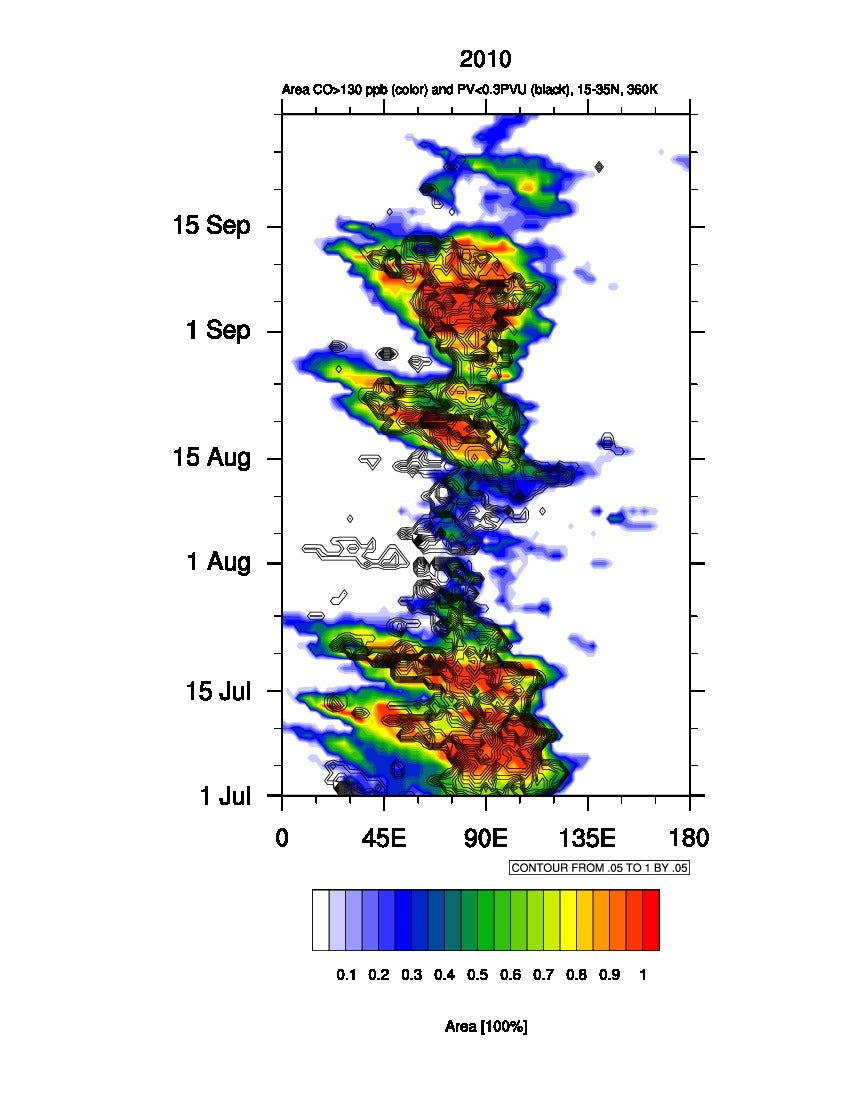
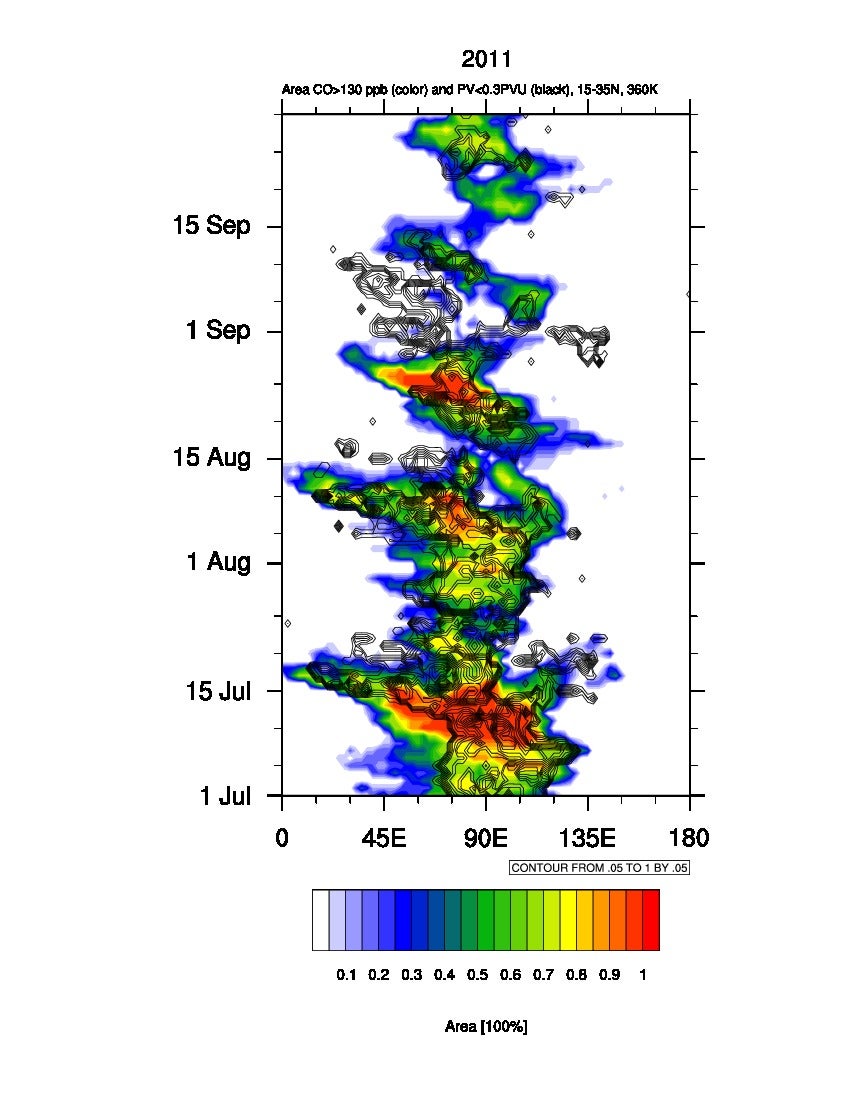
CO Hovmoeller diagrams from WACCM-SD
| 2000: | Contour |
|---|---|
| 2001: | Contour |
| 2002: | Contour |
| 2003: | Contour |
| 2004: | Contour |
| 2005: | Contour |
| 2006: | Contour |
| 2007: | Contour |
| 2008: | Contour |
| 2009: | Contour |
| 2010: | Contour |
| 2011: | Contour |
Regional Radar Images and Information
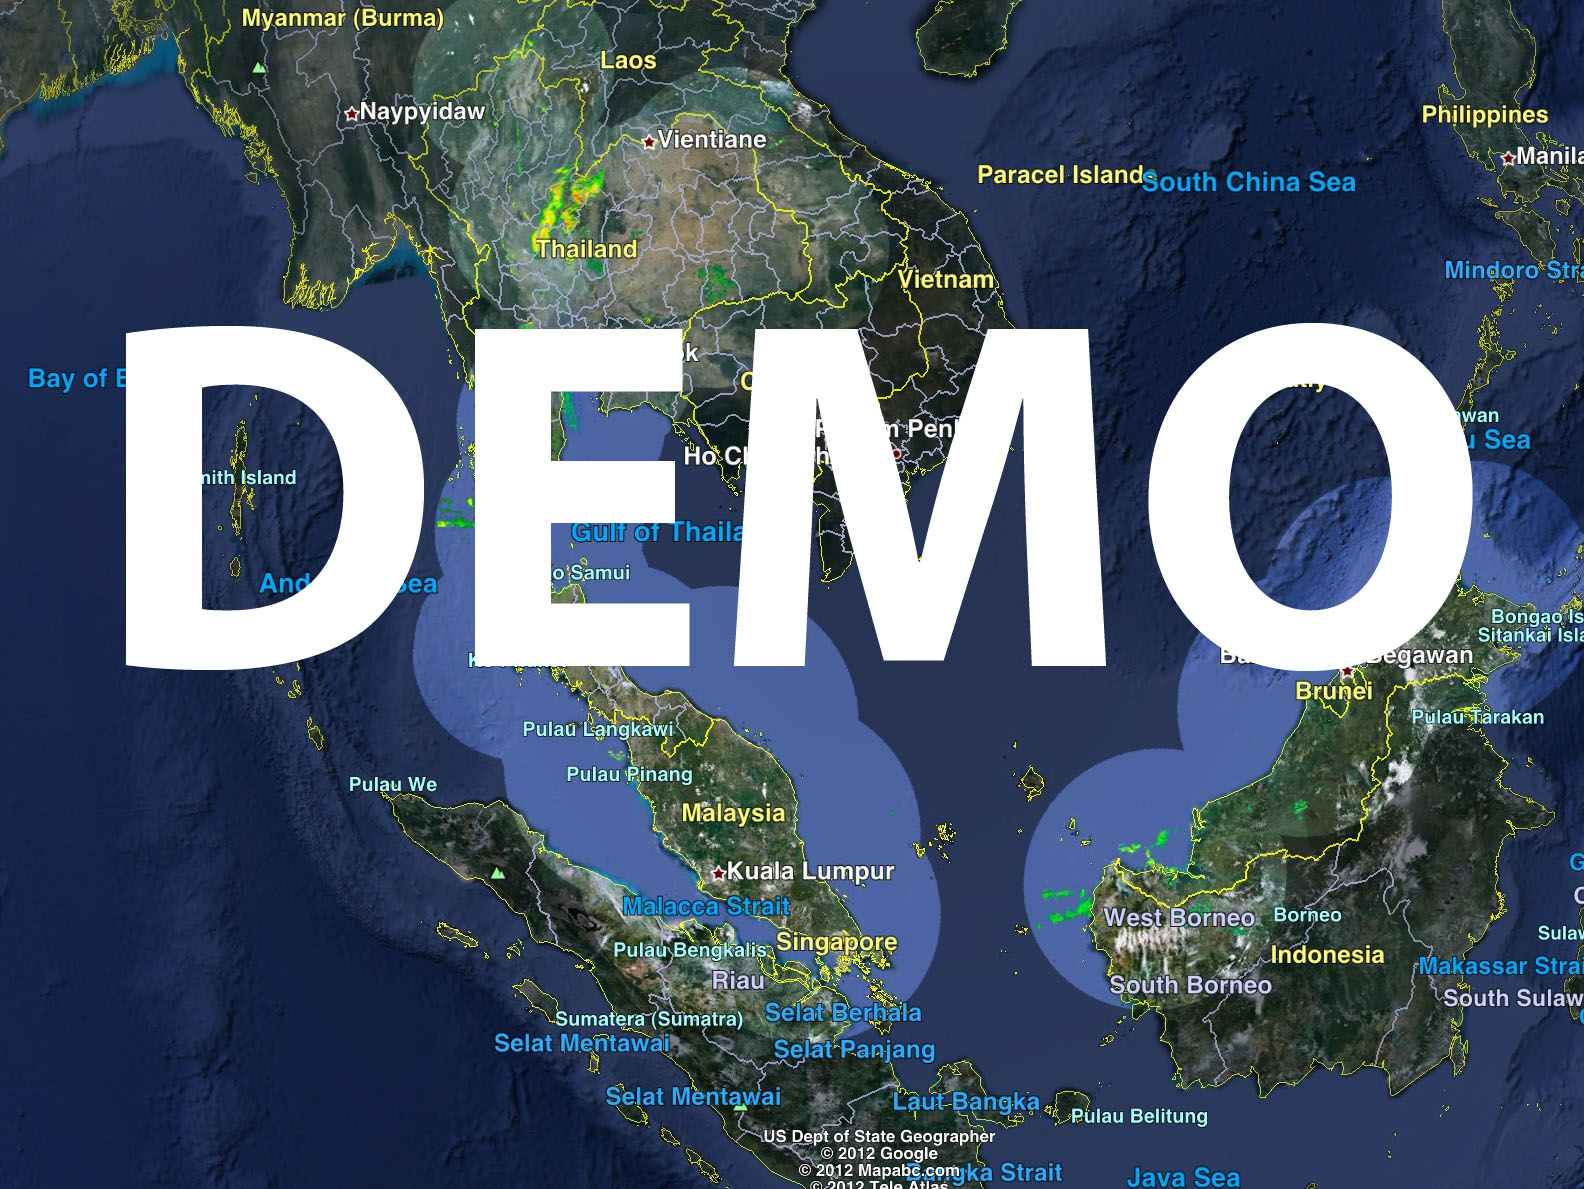 |
SEA Radar Google Earth Demo
The image link on the left is a small demo movie of the realtime Southeast Asia Radar Google Earth Kml. A description and link to the kml file is given on the right. |
|
Realtime SEA Radar KML
The link on the left accesses a KML file that is opened using Google Earth. The file allows for the viewing of near realtime (latest 4 hours) Thailand and Malaysia weather doppler radar imagery obtained from the Thailand and Malaysian Meteorological Department websites. The images are run through algorithms to crop and remove the backgrounds. The end result is the overlayed radar imagery and optional radar range background seen in the DEMO on the far left. Detailed information about all of the Southeast Asia weather radadr imagery is available in the 'Detailed SEA Radar Information' section on the lower left. |
|
|
Detailed SEA Radar Information
This document outlines all of the caveats and need-to-know items about each country's radar network and information on individual radar sites where such information is available. There is also more detailed information about the issues with the Vietnam and Bangladesh radars. Several images/movies concerning these issues are shown to the right and below. |
|
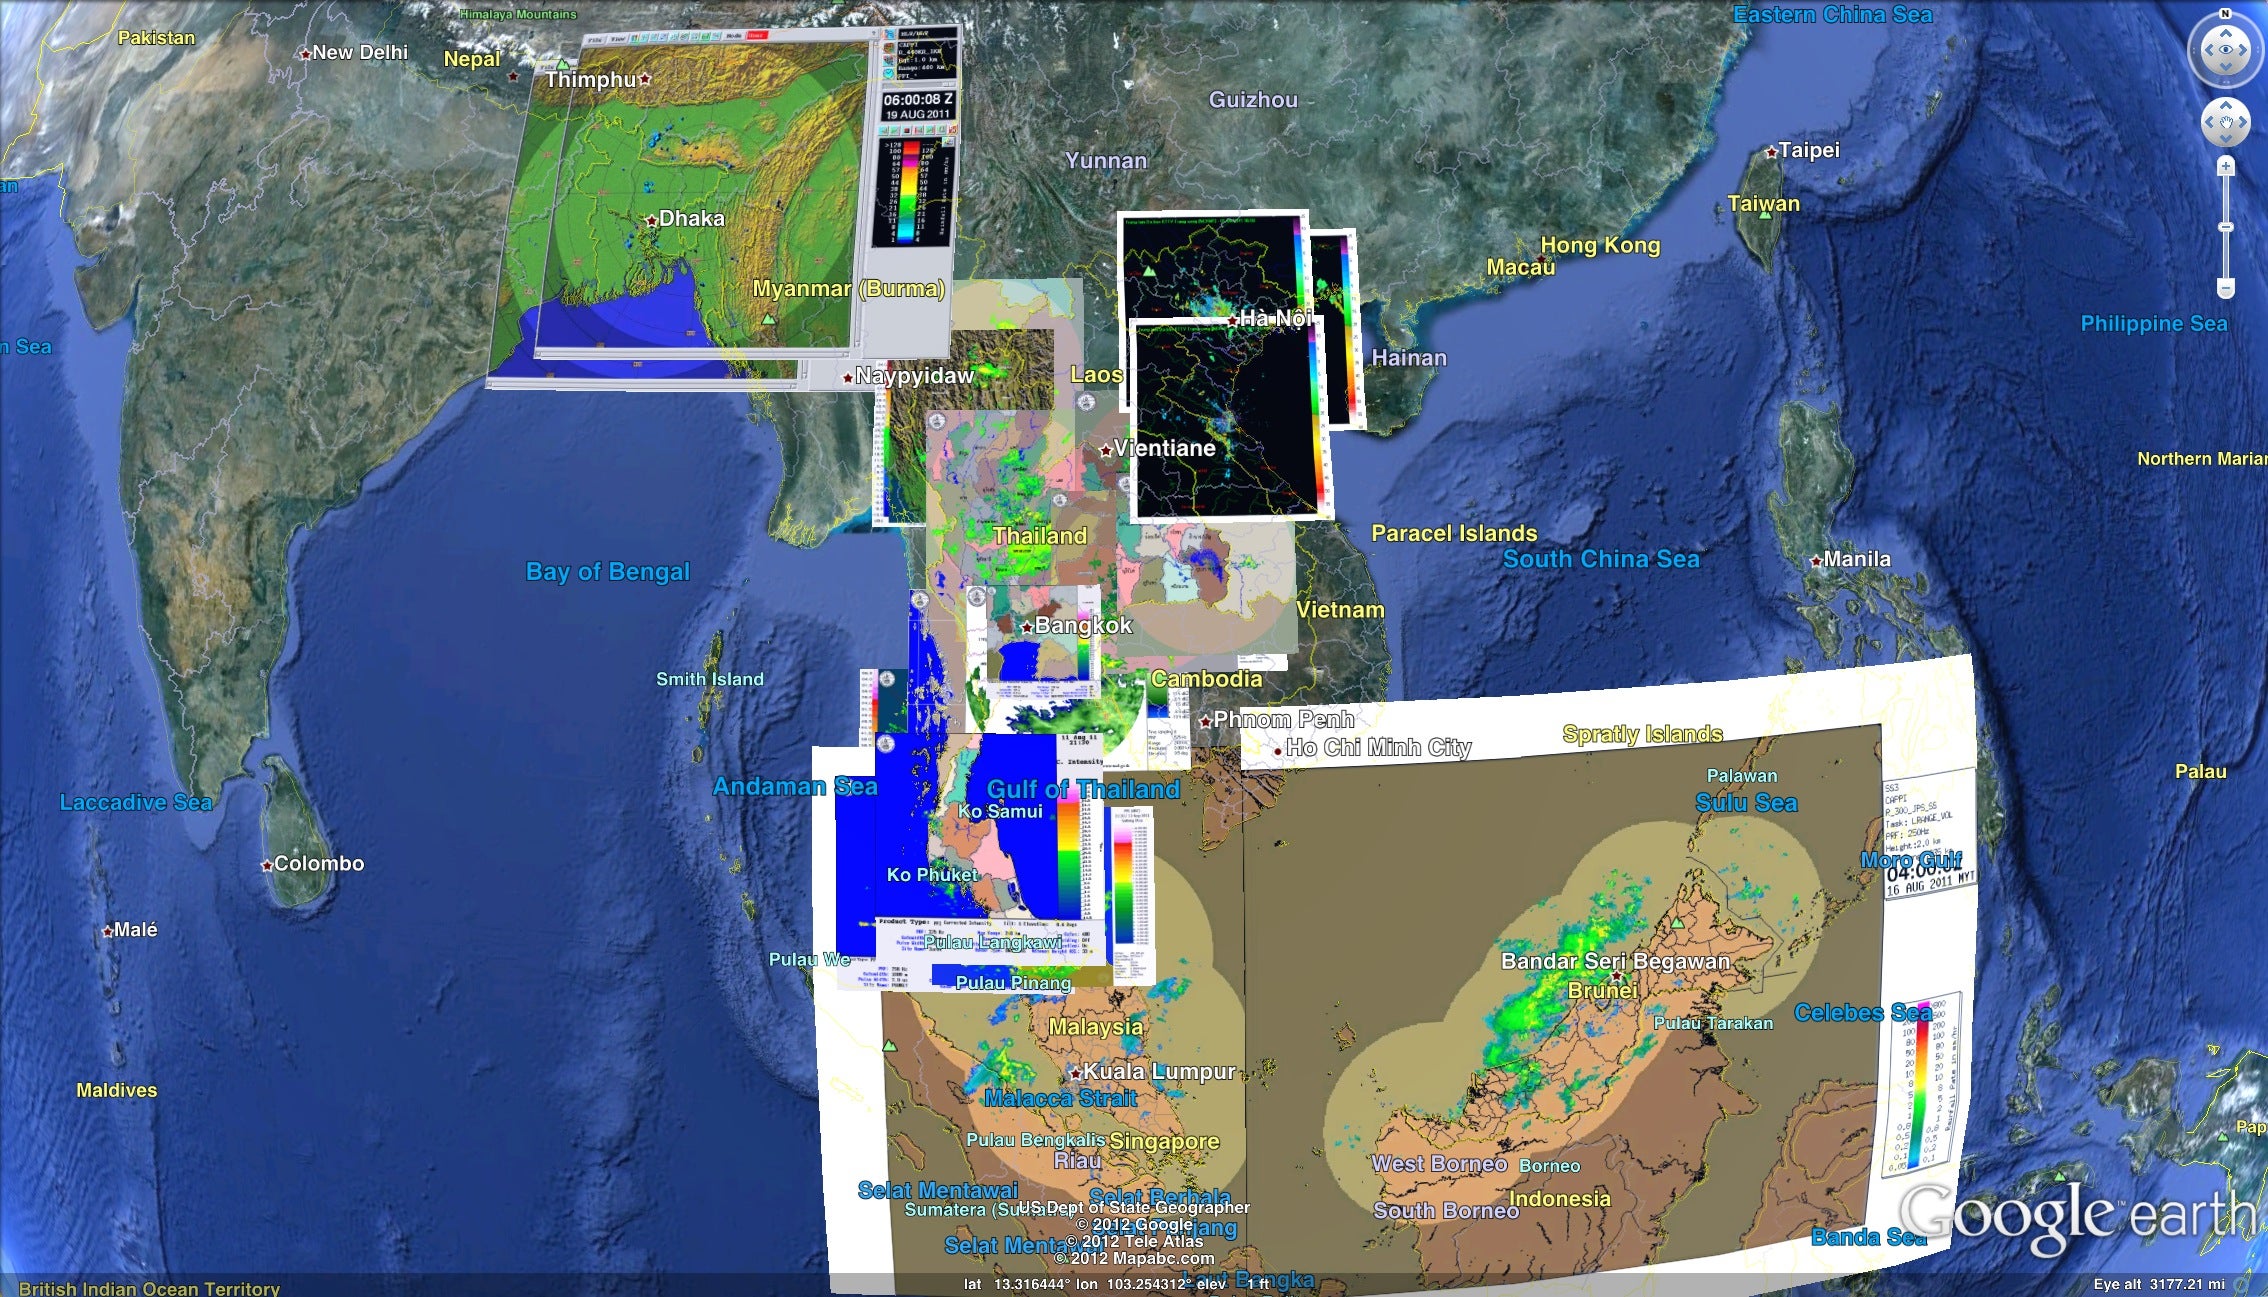
Radar - Original Overlaid Images
The image on the left shows all the original radar images. The original imagery aquired from the internet is difficult to use when all of the images are overlaid onto Google Earth at once. In order to fix this issue, all the downloaded imagery is run through algorithms to crop and remove the backgrounds so that only the radar pixels remain. The end result is the imagery displayed in the Realtime SEA Radar KML. |
|
|
Vietnam Radar Ground Clutter Issue
The image link on the left demonstrates the Vietnam radar ground clutter issue. Targets are visible as far out as 100 Km. This can make distinguising hydrometeor echoes from ground echoes difficult. Due to this problem, Vietnam is not currently being utilized. |
|
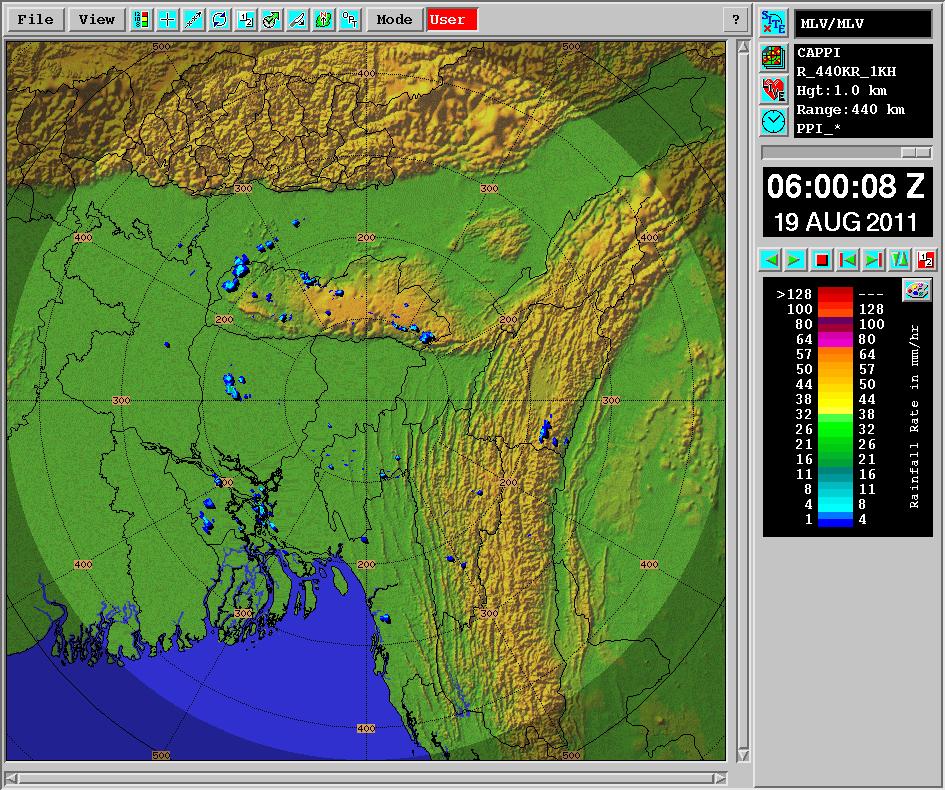
Bangladesh Radar Update Issue
The image link on the left demonstrates the Bangladesh radar update issue. There is an issue with getting consistent and timely updates. It is not uncommon for images to be several days old. This poses a problem when trying to automate retrieval. |
Email questions and comments about regional radar images and information to Shawn Honomichl at shawnh@ucar.edu