Interannual Changes in Stratospheric Water Vapor
We have derived time series of stratospheric water vapor anomalies from combined HALOE (1991-2005) and Aura MLS (2004-2012) satellite measurements. These data represent near-global (~60 N-S) averages in the lower stratosphere (83 hPa, ~17.5 km). Interannual anomalies were derived from deseasonalized HALOE and MLS data, and then combined using the overlap period during 2004-2005. Details of the data analysis are described in this paper.
The monthly and seasonal (3-month average, DJF, MAM, etc.) water vapor data are available for download.
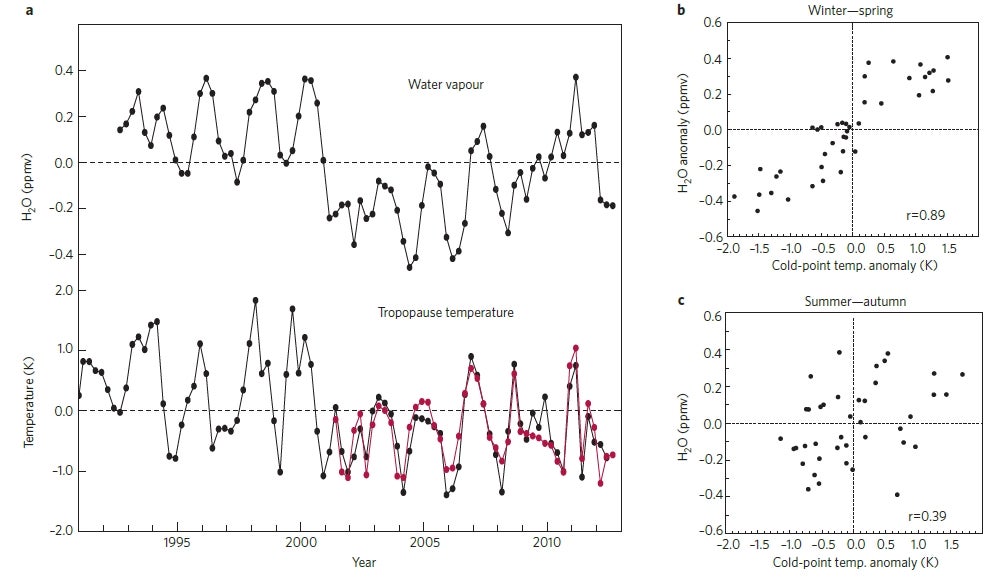
Figure 5: Interannual changes in global stratospheric water vapour are closely linked to tropical tropopause temperatures. a, Observed interannual changes in lower stratospheric water vapour from satellite measurements over the period 1992–2012 compared with interannual variations in tropical cold-point tropopause temperatures. Water vapour data are de-seasonalized near-global averages at 83 hPa from combined HALOE and MLS satellite measurements. Each dot represents a three-month average. Temperatures are de-seasonalized anomalies derived from radiosonde data (black line) and GPS radio occultation data (red line, for 2001–2012). Results are updated from ref. 93. The approximate two-year variations in the water vapour and temperature anomalies are related to influence of the stratospheric quasi-biennial oscillation (QBO). The correlation between water vapour and temperature for the entire time series is r=0.75. b,c, Scatter plots of water vapour versus cold-point temperature anomalies (with water vapour lagged by one season), showing high correlation for boreal winter–spring seasons (b) and weaker correlation for summer–autumn (c).
Figure 5 and caption from William Randel and Eric Jensen (2013) Physical processes in the tropical tropopause layer and their roles in a changing climate. Nature Geoscience 6, 169–176. doi:10.1038/ngeo1733.
Stratospheric water vapor anomalies are highly correlated with cold point tropical tropopause temperatures, as shown in the figure above. We have derived time series of deseasonalized cold point temperatures from radiosonde measurements at a few stations with high quality long-term measurements (Nairobi, Majuro and Manaus) (as described here). Furthermore, since 2001 GPS radio occultation measurements have provided accurate measurements of the cold point tropopause, with much better space-time sampling than radiosondes. The interannual anomalies derived from GPS data agree well with the radiosonde results during 2001-2012, as shown above.
The monthly cold point tropopause temperature anomalies shown above are available here from the radiosondes and GPS data. The seasonal (3-month average) radiosonde anomalies are here.