First Satellite Identification of Volcanic Carbon Monoxide
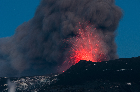
The composition and magnitude of volcanic gas emissions contain keys to understanding and predicting volcanic events. Additionally, some volcanic gases have a positive radiative forcing and thus impact climate. Volcanic gases are mostly analyzed in situ or using airborne instruments, with all the consequent limitations in safety and sampling, and at elevated costs. A study reporting the first satellite identification of volcanic CO has been published in GRL and highlighted in Eos Research Spotlight. Only volcanic SO2, HCl, and H2S had been successfully detected from satellites before.
The identification of volcanic CO has been achieved using data from two independent instruments: MOPITT and IASI. Other volcanic markers (elevated MODIS aerosol optical thickness, OMI SO2) are spatially and temporally co-located with the anomalous CO values and thus confirm their volcanic origin. A spurious origin for the anomalous CO values due to enhanced water vapor or aerosols in the volcanic plume has been ruled out by modeling the effect of water vapor in MOPITT radiances and analyzing IASI brightness temperature spectra. The CO concentrations measured by MOPITT and IASI are comparable in magnitude to airborne measurements.
CO emissions have a positive indirect radiative forcing of approximately 0.2 W/m2 (i.e., 12.5% of the total net anthropogenic forcing). Global CO emissions range widely; fluctuations in natural sources (e.g., volcanic degassing) need to be quantified so as to separate them from those of anthropogenic origin. Based on mean global volcanic CO2 and in situ volcanic CO and CO2 measurements, the authors estimate that global average volcanic CO emissions may be on the order of 5.5 Tg/year. This is equivalent to the annual CO emissions produced by fuels (fossil and biofuel) in Australia. Though modest compared to anthropogenic sources, volcanic CO emissions are non-negligible.
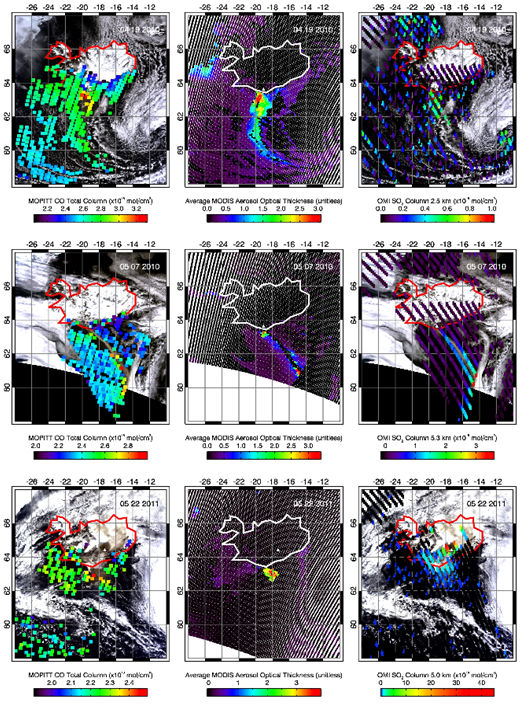
Figure 1. Volcanic markers mapped for the three dates analyzed. Iceland’s contour and the location of the active volcanic vent (white triangle) are shown for clarity. Left panel - MOPITT total CO column values over coeval MODIS true color image. Middle panel - MODIS aerosol optical thickness. Right panel - OMI total SO2 column over coeval MODIS true color image.
REFERENCES
Martínez-Alonso, S., Deeter, M. N., Worden, H. M., Clerbaux, C., Mao, D., and Gille, J. C. (2012). First satellite identification of volcanic carbon monoxide. Geophysical Research Letters, 39, L21809, doi: 10.1029/2012GL053275.
Schultz, C. (2012) Research Spotlight: First satellite detection of volcanogenic carbon monoxide. EOS, Transactions American Geophysical Union, 94, 5, doi:10.1002/2013EO050014.