Carbon Monoxide Variability over the United States
Understanding the spatio-temporal distribution of air pollution is made easier if we are able to differentiate between the different processes driving pollutant variations. This involves understanding how the surface and tropospheric concentrations at a given time and location are governed by direct emissions of pollution, chemical processing and transport into the region from further afield.
We are using the regional chemistry transport model WRF-Chem V3.2 at 24 x 24 km2 spatial resolution to analyse the carbon monoxide (CO) variability over the U.S. in summer 2008. CO is emitted from combustion sources and is a well-suited tracer of pollution sources and transport owing to its week-long lifetime in the troposphere. CO tracers (or ‘tags’) for different emission sources are included in the simulations to break down the modelled CO fields into the contributions from individual source terms [Pfister et al., 2010]: CO emitted from regional anthropogenic (COanthro) and fire (COfire) sources, CO produced photochemically within the domain (COchem) and CO inflow (CObc). The latter tracks the transport of CO at the lateral boundaries through the domain. Using these tracers help us to examine the different components contributing to observed CO concentrations.
Figure 1 shows the variability of observed and model-simulated CO at the surface for a rural and an urban Environmental Protection Agency (EPA) monitoring site as well as the CO tracer variability associated with each site. Overall, the model reproduces fairly well the variability and magnitude of observed CO concentrations, but there are discrepancies. At the rural site the CO peaks are less pronounced in the model compared to the observations. The analysis of the CO tracer variability shows that this increase is related to the fire and anthropogenic tracers, which likely are underestimated in the model. While enhanced concentrations are related to regional sources, the dominant source of CO at this site is estimated as being pollution inflow. At the urban site the CO variability is characterized by two pronounced peaks during the first part of the simulation period. The model suggests that both peaks are linked to anthropogenic and fire emissions but there is a mismatch in the modeled magnitude and also the timing. Compared to the rural sites, the relative contribution of transported pollution is clearly reduced.
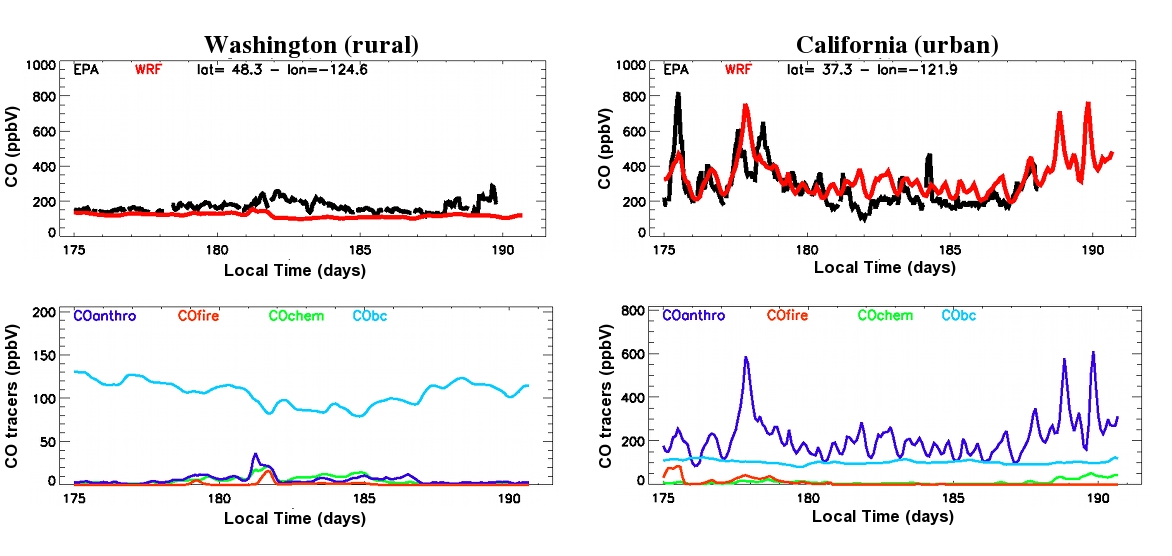
Figure 1. Temporal variability of observed (black) and simulated (red) surface CO (top panel) and CO tracers (bottom panel) at a rural site in Washington state and at an urban site in California. Click on figure for larger image.
Air pollution monitoring is currently based on surface networks that have good temporal, but limited spatial coverage and no information about the atmospheric vertical distribution. Over the recent years, satellite observations have been used for studying tropospheric composition. Satellites provide good spatial coverage and some vertical information albeit limited information at the surface. Thermal infrared (TIR) sensors in particular are primarily sensitive to CO concentrations in the lower free troposphere (FT) around 2-3 km and the question arises to what degree these satellite retrievals can be used for AQ monitoring.
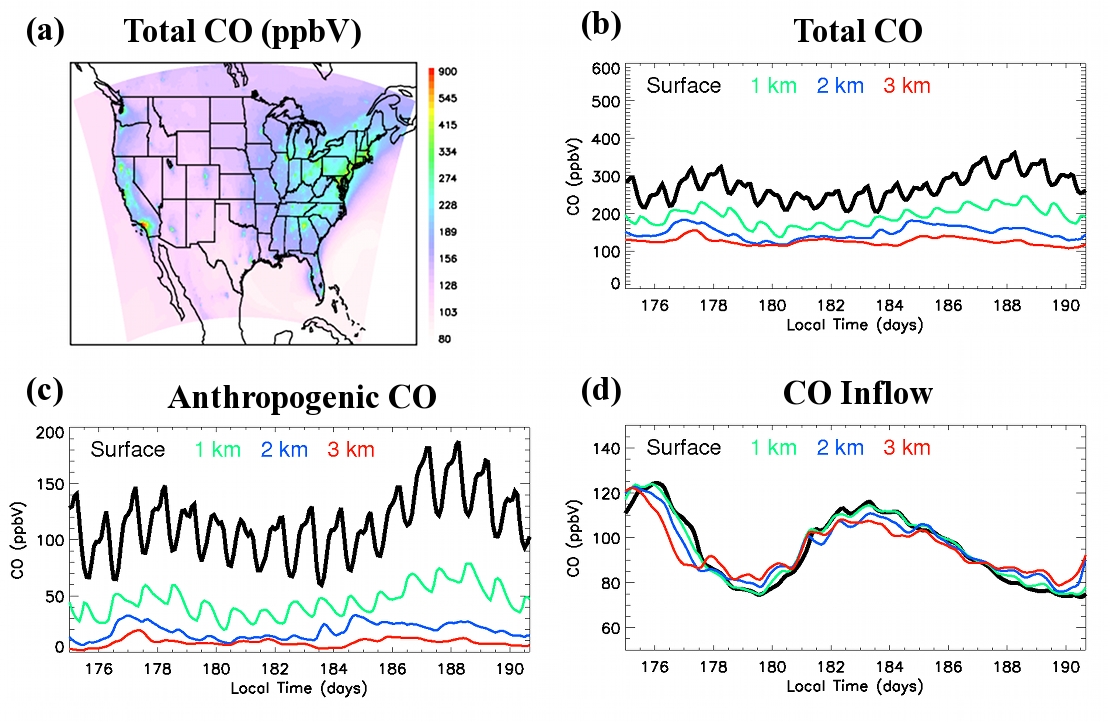
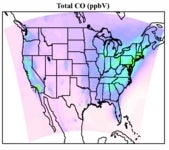
Figure 2. (a) Spatial distributions of the surface concentrations of total CO averaged over the period 24 June – 10 July, 2008. (b), (c) and (d) Temporal variability of concentrations of total CO, anthropogenic CO and CO inflow at four different altitudes (the surface, 1 km, 2 km and 3 km) averaged over the most polluted Eastern U.S. regions (see black box in Figure 2a). Click on figure for larger image.
To answer this question, we analyze the CO vertical structure for highly polluted regions over the Eastern U.S. (see Figure 2a). Figure 2b shows time series of CO concentrations at the surface and at different altitude levels (1, 2 and 3 km). The figure also includes time series for the most dominant sources of CO in this region (anthropogenic CO and CO inflow). The fine scale variability in CO at the surface, which is mostly related to the anthropogenic tracer, is not reflected higher up in the FT. However, the large scale patterns, which are correlated with the inflow tracer, translate to the higher altitudes and are significantly larger in magnitude compared to the anthropogenic signature (by 100 ppbV). This suggests that a TIR sounder will observe predominately the variability in pollution inflow.
The results demonstrate that for AQ applications satellite products with increased sensitivity towards the surface are needed. The new Measurement of Pollution in the Troposphere (MOPITT) V5 multispectral CO retrieval [Worden et al., 2010], which will be released in 2011, shows real sensitivity at the surface and is capable of a meaningful surface retrieval of CO concentration. Building on this development, we are exploring the use of this new technique for AQ retrievals of CO and ozone from the next-generation of geostationary satellite missions such as the GEOstationary Coastal and Air Pollution Events (GEO-CAPE) mission.
References
EPA, US Environmental Protection Agency Air Quality System Data Mart [internet database] available at http://www.epa.gov/ttn/airs/aqsdatamart . Accessed 2010.
Pfister, G. G., Avise J., Wiedinmyer C., Edwards, D. p., Emmons L.K., Diskin G. D., Podolske J., and Wisthaler A.: CO Source Contribution Analysis for California during ARCTAS-CARB, submitted to Atmos. Chem. Phys. Discuss., 2010.
Worden, H. M., Deeter, M. N., Edwards, D. P., Gille, J. C., Drummond, J. R., and Nédélec, P.: Observations of near-surface carbon monoxide from space using MOPITT multispectral retrievals, J. Geophys. Res., 115, D18314, doi:10.1029/2010JD014242, 2010.