Global Analysis of Carbonyl Sulfide
Carbonyl sulfide (OCS) is the most abundant sulfur containing gas in the atmosphere. There are many sources and sinks of OCS and other sulfur species into the atmosphere though most other short lived sulfur species are eventually converted to OCS in the free troposphere. Hence, we refer to OCS as the dominant reservoir sulfur species. There are two vitally important reasons to quantify and understand atmospheric OCS. First, it is used to evaluate CO2 uptake by plants since its uptake rates are similar to CO2 but its release is not, so it provides insight into this difficult to quantify aspect of the global carbon cycle. Secondly, as it is long lived in the free troposphere (2-3y), it is the largest source of sulfur transported into the stratosphere outside of very large volcanic injections (e.g., el Chichón or Pinatubo) where it maintains the Junge (sulfate aerosol) layer at about 20km altitude in the lower stratosphere. This layer is very important for earth’s energy balance, especially in a changing climate and is the natural component of stratospheric aerosol that may be altered or enhanced via some climate mitigation scenarios. Both surface interactions and stratospheric contributions by OCS are very active areas of research for which there are not many direct observations.
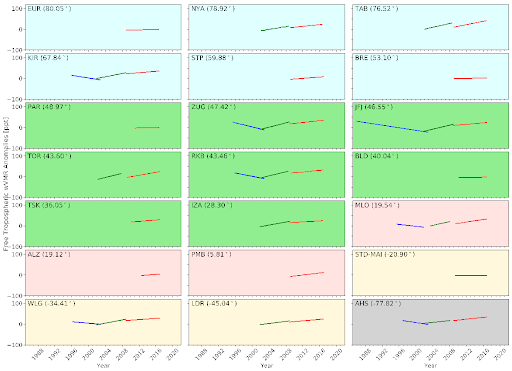
Through our association with the global Network for the Detection of Atmospheric Climate Change (NDACC) we led an analysis of OCS observations, trends and sources. This global study presenting data from 22 observation stations representing all continents, ranging from 79°S to 80°N in latitude and spanning from (at earliest) 1986 to 2020 in time is the most comprehensive whole atmosphere OCS dataset available.
Figure 1 (below) shows free tropospheric anomalies in weighted volume mixing ratio of monthly mean OCS. These plots show fascinating features. The earliest data series show a decrease in the amount of OCS leading into about 2002 (e.g. JFJ, KIR or AHS) then an increase that in some cases changes around 2008-2010. More recently all stations show a decrease around 2016-2017. As OCS is long lived these features are largely persistent globally though show a lag in Arctic data of about 1-2 seasons.
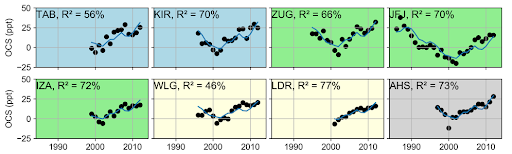
Desiring to know why these changes occur, regression analysis with several dynamical, oceanic and biogenic source related proxies showed little correlation. Figure 2 though, shows very high correlations at a subset of stations (chosen due to time overlap) with bottom-up anthropogenic emission inventory in the free tropospheric data. We conclude that most of the trend in OCS is due to human activity and that the downturn recently seen since 2016 is likely also due to anthropogenic emissions.
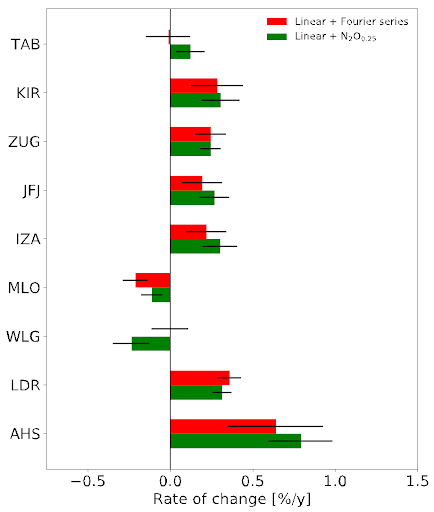
Finally, Figure 3 shows stratospheric trends calculated with and without using N2O as a dynamical tracer, between 2001 and 2016 on sites with the appropriate length data series. Looking at the tracer-based trend outside of the subtropics the OCS burden is increasing from about 0.25%/yr in the Arctic to 0.75%/y in the Antarctic inferring that OCS is not limiting sulfate aerosol production in steady state. The negative trends in the subtropics signals diminishing stratospheric transport. Evidence of this is not exclusively seen in the other stratospheric trends since the calculated lifetimes range from 54 to 103 years in the subtropics to Poles respectively.