Initial findings on the impact of the COVID-19 economic slowdown on trace atmospheric species
The COVID-19 pandemic that quickly expanded in the beginning weeks of 2020 led to large scale reductions and temporary closures of businesses across the globe. The measures implemented to reduce the spread of the virus began in March in North America and earlier in Europe are hugely impactful and are projected to have a reduction in US GDP of up to 6.1% (World Bank, 2020). They caused a reduction in anthropogenic emissions (Guevara, et al., 2020) that can lead to a reduction of ozone precursor species.
The Optical Techniques group has been making observations at remote locations at Mauna Loa, HI and Thule Greenland for many years and since 2010 at the suburban Boulder, CO NCAR Foothills campus. The site is the sole NDACC FTIR station in the continental US. To make an informed first measure of a possible impact on the Front Range troposphere we compare the monthly average of the weighted mean lower tropospheric volume mixing ratios (wVMR) from 2010 through 2019 with same quantities for 2020. Plots for CO, C2H2, C2H6, H2CO, NH3, HCN and O3 are given in Figure 1. We measured lower values for CO, C2H2, C2H6, H2CO that have large anthropogenic sources through July. This may in part lead to the large lower O3 amounts observed through the same period. The trends abruptly change in August as plumes from several wildfires in California and in Colorado that persisted through October dominated emissions in observed airmasses and as commercial constraints due to COVID-19 were reduced. This is shown by strong increases in all species in August including NH3 and biomass burning tracer HCN, except for O3 which persisted below average but less so.
Figure 2 shows the percent difference by month for the year. CO shows a small 3-8%, but persistent deficit. C2H2 was persistent but larger up to 25% March through July. C2H6 shows a decrease up to 25% in July but no change in May. H2CO shows a rapid change from up to a 40% loss in April to zero in June and near no change until fires began in August. Further analysis is needed to ascertain true background and local emission losses. The data can be further binned by source region to be more quantitative for actual emission changes. The mean April – August deficit in O3 at Boulder is 9.8%. This is in line with observed anomalous decrease in lower tropospheric O3 that was widespread in the northern hemisphere (Steinbrecht, et al., 2020).
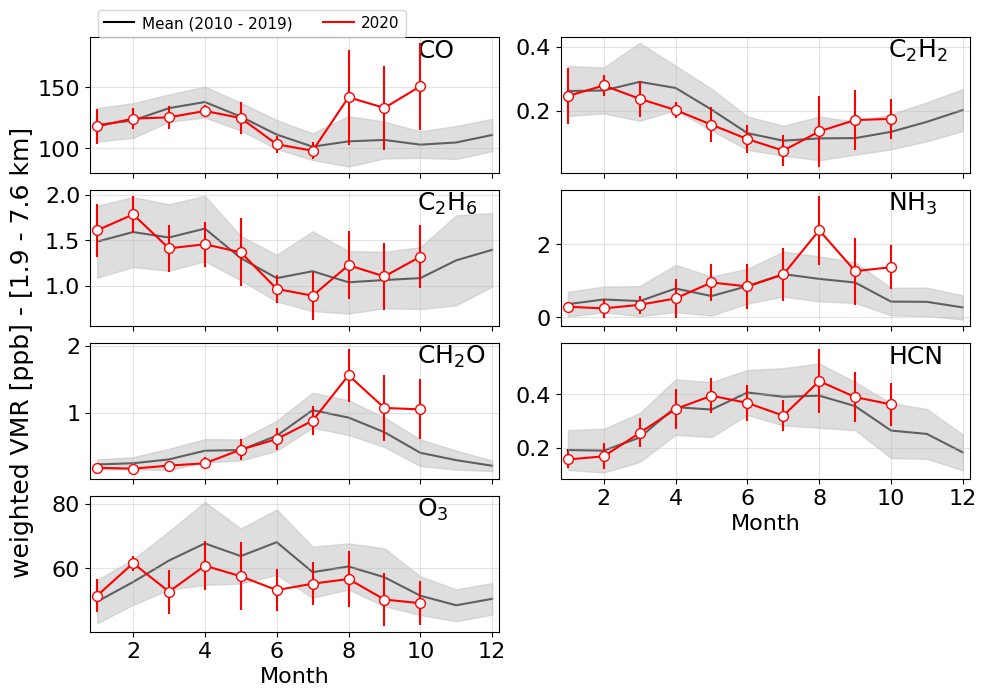
Figure 1. The annual cycles of wVMR monthly means for seven troposphere species. Black lines and gray shade are the 2010-2019 average data and ± 1 standard deviation. The red lines are the monthly means with vertical lines as ± 1 standard deviation for each month in 2020.
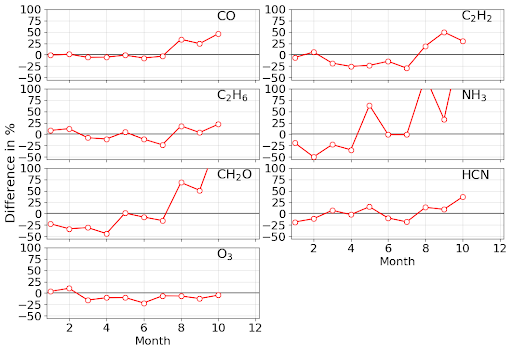
Figure 2. Percent difference by month for the same species between 2020 and the mean of the previous 10 years.
References
“COVID-19 to Plunge Global Economy into Worst Recession since World War II”, 8 June 2020, The World Bank, https://www.worldbank.org/en/news/press-release/2020/06/08/covid-19-to-plunge-global-economy-into-worst-recession-since-world-war-ii
“Time-resolved emission reductions for atmospheric chemistry modelling in Europe during the COVID-19 lockdowns”, Guevara, M., Jorba, O., Soret, A., Petetin, H., Bowdalo, D., Serradell, K., et al. (2020, in review). Atmospheric Chemistry and Physics Discussions.https://doi.org/10.5194/acp-2020-686
“Did the covid-19 crisis reduce free tropospheric ozone across the northern hemisphere?”,2020, Steinbrecht, W., Kubisti, D., Plass-Du ̈lmer, C., Davies, J., Tarasick, D. W., von der Gathen, P., Deckelmann, H., Jepsen, N., Kivi, R., Lyall, N., Palm, M., Notholt, J., Kois, B., Oelsner, P., Allaart, M., Piters, A., Gill, M., Malderen, R. V., Delcloo, A. W., Sussmann, R., Mahieu, E., Servais, C., Romanens, G., Stu ̈bi, R., Ancellet, G., Godin-Beekmann, S., Yamanouchi, S., Strong, K., Johnson, B., Cullis, P., Petropavlovskikh, I., Hannigan, J. W., Hernandez, J.-L., Rodriguez, A. D., Nakano, T., Fernando, Chouza, Leblanc, T., Torres, C., Garcia, O., R ̈ohling, A. N., Schneider, M., Blumenstock, T., Tully, M., Paton-Walsh, C., Jones, N., Querel, R., Strahan, S., Stauffer, R. M., Thompson, A. M., Inness, A., Engelen, R., Chang, K.-L., and Cooper, O. R., Geophysical Research Letters, (accepted).