Improved East Asia model distributions of oxidants during KORUS-AQ after CO data assimilation
Severe episodes of air pollution occur during spring in East Asia. Understanding the mechanisms that cause the photochemical pollution episodes is a complex task that relies on ground-based in-situ networks, satellite remote sensing observations and numerical models. The National Aeronautics and Space Administration (NASA) and Korea’s National Institute of Environmental Research (NIER) coordinated the Korea‐United States Air Quality Study (KORUS‐AQ) field campaign which provided comprehensive trace gas and meteorological measurements from ships, aircraft and ground sites during May and early June 2016 over South Korea.
At ACOM, we assimilated satellite measurements of carbon monoxide (CO) from the Measurement of Pollution in The Troposphere (MOPITT) satellite instrument within the Community Atmosphere Model with chemistry (CAM-chem). Comparisons to KORUS-AQ aircraft observations show that the MOPITT assimilation improves CO for a wide range of altitudes and especially towards the surface (Figure X). In comparison to KORUS-AQ observations, CO is underestimated by 42 % in the Control-Run, but that difference is decreased to 12 % in the MOPITT assimilation run. Additional comparisons with different inventory datasets suggest an underestimation of human-caused emissions in the region. An important finding of these simulations is that correcting the underestimation in anthropogenic CO emissions also improves the model simulations of other observed compounds, including ozone (O3), a regulated pollutant and other important oxidants. We also found an underestimation of biogenic emissions, as illustrated by the comparison with formaldehyde (CH2O). An optimized simulation (CAM-chem-Optimized) with improved emissions of anthropogenic CO and of emissions of Volatile Organic Compounds from biogenic sources show a lower O3 bias. Results suggest that controlling Volatile Organic Compounds and CO emissions, in addition to widespread NOx controls, can improve ozone pollution over East Asia.
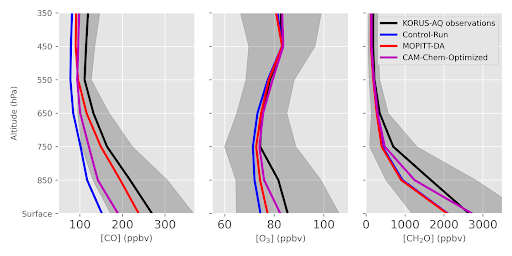
Figure 1: Average CO profiles (left panel), O3 (middle panel) and CH2O (right panel) average over the whole campaign (May-June 2016). The mean (black line) and standard deviation (shaded grey) of the NASA DC-8 aircraft observations are calculated for each 100 hPa bin.
References
Gaubert, B., Emmons, L. K., Raeder, K., Tilmes, S., Miyazaki, K., Arellano Jr., A. F., Elguindi, N., Granier, C., Tang, W., Barré, J., Worden, H. M., Buchholz, R. R., Edwards, D. P., Franke, P., Anderson, J. L., Saunois, M., Schroeder, J., Woo, J.-H., Simpson, I. J., Blake, D. R., Meinardi, S., Wennberg, P. O., Crounse, J., Teng, A., Kim, M., Dickerson, R. R., He, H., and Ren, X.: Correcting model biases of CO in East Asia: impact on oxidant distributions during KORUS-AQ, Atmos. Chem. Phys. Discuss., https://doi.org/10.5194/acp-2020-599, in press, 2020.