Variability in upwelling across the tropical tropopause and correlations with tracers in the lower stratosphere
The mean circulation of the tropical lower stratosphere is characterized by upwelling, which transports air masses across the tropopause into the lower stratosphere. This is part of the global overturning Brewer-Dobson circulation. However, this upwelling circulation is weak and cannot be measured directly, but is inferred from diagnostic calculations or observed tracer transport.
Variability in tropical upwelling is mirrored in temperature and tracers with strong vertical gradients in the lower stratosphere. We have used temperature observations along with Aura MLS satellite observations of ozone and carbon monoxide (CO) in the tropical lower stratosphere to quantify the effects of upwelling.
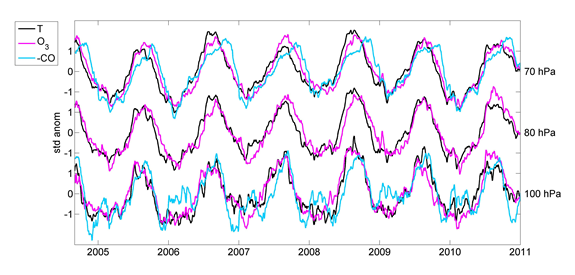
Figure 1 shows the time series of temperature, ozone and CO at several levels above the tropopause, showing highly coherent variability that reflects the effect of upwelling. The time series exhibit large seasonal cycles which reflect the annual cycle in circulation (stronger upwelling during boreal winter); annual variations in temperature are almost in-phase with ozone and out-of-phase phase with CO (because CO has an oppositely signed vertical gradient compared to ozone). There are also coherent fluctuations on sub-seasonal timescales among the series, related to transient variability in upwelling. Our analyses compare several separate estimates of upwelling derived from ERA-interim reanalysis (which show overall good agreement), and we quantify the importance of upwelling in controlling variability in the lower tropical stratosphere.
This work is published recently in ACP:
Abalos, M., Randel, W. J., and Serrano, E.: Variability in upwelling across the tropical tropopause and correlations with tracers in the lower stratosphere, Atmos. Chem. Phys., 12, 11505-11517, doi:10.5194/acp-12-11505-2012, 2012.

Fig. 1. Time series of standardized anomalies of daily temperatures from ERA-Interim and ozone and CO mixing ratio measurements from MLS averaged over 18_ N–S at three pressure levels across the tropical tropopause (70, 80 and 100 hPa from top to bottom; levels shown for MLS are 68, 83 and 100 hPa). 3-days running means are applied to the daily series. CO concentrations are plotted on a reversed scale in order to highlight the common fluctuations.
