Ultraviolet Radiation in Polluted Environments
Photochemical smog is a byproduct of the NOx-catalyzed oxidation of volatile organic compounds (VOCs) under solar ultraviolet (UV) radiation. While the chemical regime can be NOx-limited, VOC-limited, or NOx-inhibited, it is always photon limited and therefore sensitive to changes in the UV radiation field. In polluted regions, these radiation changes can be caused by the smog itself, especially ozone (O3), nitrogen dioxide (NO2), and aerosol particles. Thus an interesting and important feedback exists by which photochemical smog production depends on the UV radiation, but can also modify it.
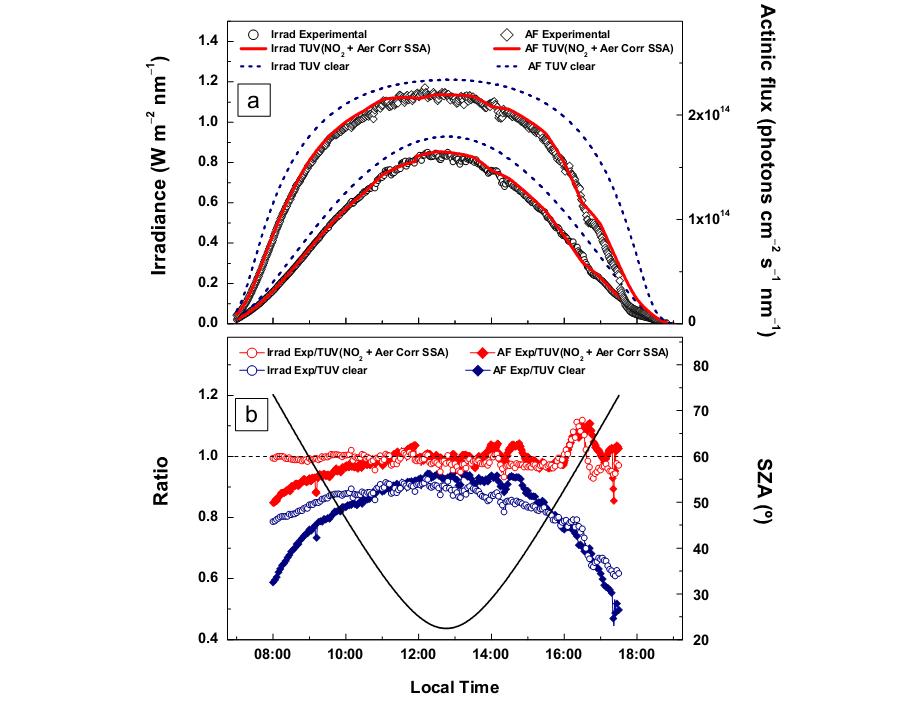
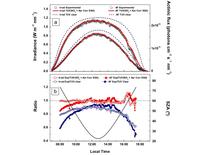
Figure 1: (a) Measured and calculated actinic flux and irradiance at 368 nm, for 13 March 2006 at the T1 MIRAGE supersite. (b) Measurement/model ratios before and after correction for aerosols and NO2.
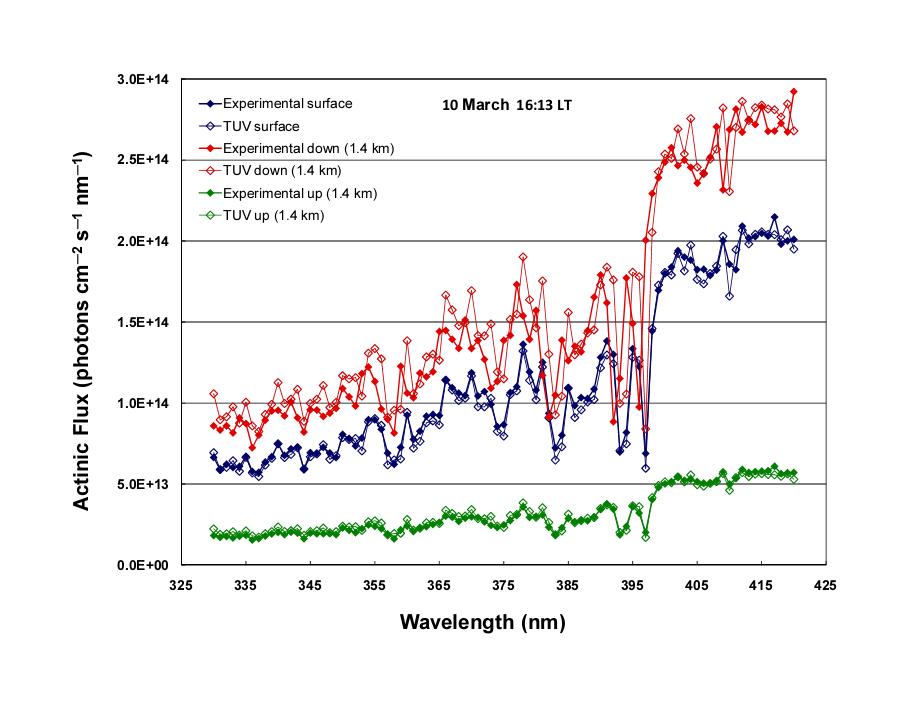
Figure 2: Spectral actinic flux measured from the C-130 aircraft (solid markers) and surface during an overpass of the T1 site, and calculated with the TUV model (open markers) using as input aerosol and NO2 data from the ground site. A spectral offset of about 1 nm is evident in one of the instruments.
High quality measurements of the UV actinic flux and irradiance were made in and near Mexico City during the March 2006 MIRAGE field campaign, and were compared with the results from the TUV model. Measurements of key pollutants were available and were used as input to the model. Aerosols (scattering and absorption) accounted for about 2/3 of the pollution effect on UV radiation, with NO2 accounting for the other 1/3. With these inputs, the TUV model predicted surface irradiances and actinic fluxes to within ±3% for high sun, and ±10% for low sun. Figure 1 shows typical surface results from a cloud-free day. Figure 2 shows the actinic flux spectra measured from the C-130 aircraft during MIRAGE T1 supersite overpasses. The availability of aerosol and NO2 data at T1 allows accurate model simulation of the measured spectral actinic fluxes.
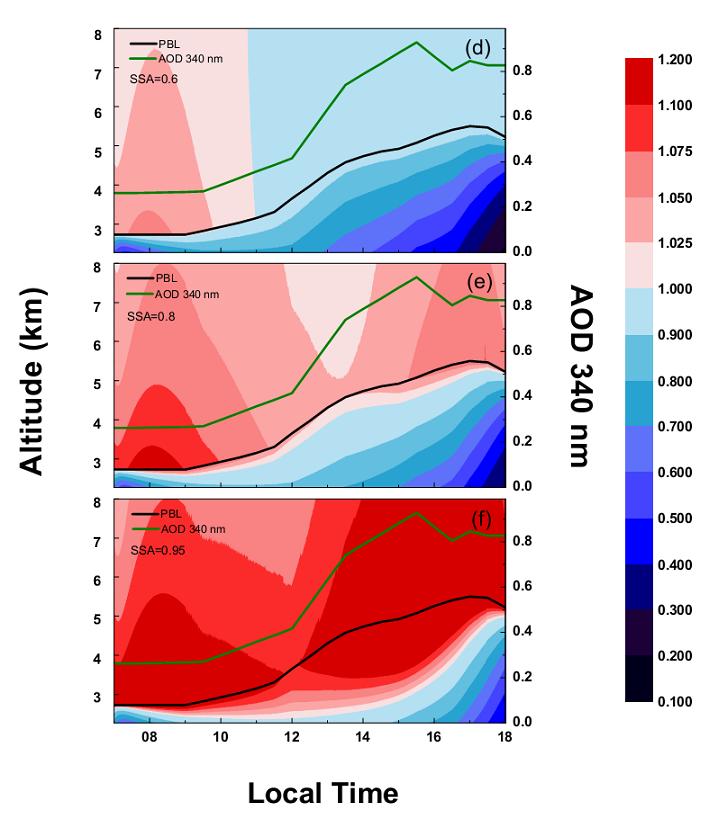
Figure 3: Effect of aerosols on the UV actinic fluxes. Blue colors indicate reductions (relative to unpolluted skies), while red colors indicate enhancements. Aerosol optical depth and PBL height are also shown. Upper panel: Strongly absorbing aerosols (ssa = 0.60). Middle panel: Best-estimate aerosols for MIRAGE T1 site (ssa = 0.80). Lower panel: Strongly scattering aerosols (ssa = 0.95).
When input data on aerosols and NO2 are not available, large errors in actinic fluxes may result, and UV radiation measurements made at the surface may belie more complex changes aloft. This is illustrated in Figure 3, where the actinic flux perturbation is calculated for different aerosol single scattering albedo (ssa). If the aerosol is mostly scattering (ssa = 0.95) actinic fluxes can be enhanced through much of the PBL even though surface measurements show lower radiation levels. On the other hand, if the aerosol is highly absorbing (ssa = 0.60) the reductions persist at all altitudes, not only in the PBL but also in the middle and upper troposphere, due to absorption of back-scattered radiation.
Reference:
Palancar, G. G., Barry L. Lefer, S. R. Hall, W. J. Shaw, C. A. Corr, S. C. Herndon, and S. Madronich, Effect of aerosols and NO2 concentration on ultraviolet actinic flux near Mexico City during MILAGRO: Measurements and model calculations, in prep. 2012.