Projections of future summertime ozone over the U.S.
Regional chemistry-climate model simulations of present and future conditions were performed to assess changes in surface ozone in the summertime U.S. [Pfister et al., 2014]. The Nested Regional Climate Model with Chemistry (NRCM-Chem), based on WRF-Chem, was used to simulate, at high spatial resolution, the present and a 2050 future time period under the A2 climate and Representative Concentration Pathway (RCP) 8.5 anthropogenic precursor emission scenarios. Predicted changes in regional climate and globally enhanced ozone are estimated to increase surface ozone over most of the U.S.; the 95th percentile for daily 8 h maximum surface ozone increases from 79 ppb to 87 ppb. The analysis suggests that changes in meteorological drivers likely will add to increasing ozone, but the simulations do not allow separating meteorological feedbacks from that due to enhanced global ozone. Stringent emission controls can counteract these feedbacks; if implemented as in RCP8.5, the 95th percentile for surface ozone is reduced to 55 ppb. A comparison of regional to global model projections shows that the global model is biased high in surface ozone compared to the regional model and compared to observations. On average, both the global and the regional model predict similar future changes but reveal pronounced differences in urban and rural regimes that cannot be resolved at the coarse resolution of the considered global model. This study confirms the key role of emission control strategies in future air quality projections and demonstrates the need for considering degradation of air quality with future climate change in policy making. It also illustrates the need for high-resolution modeling when the objective is to address regional and local air quality or establish links to human health and society.
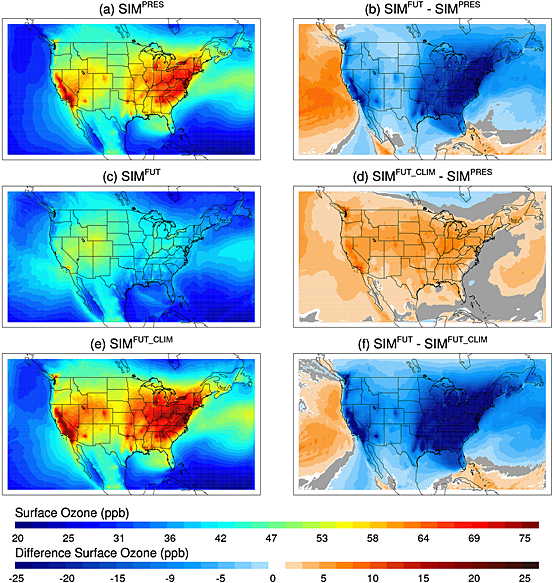
Maps of daily maximum 8 h surface ozone for JJA for (a, c, e) SIMPRES, SIMFUT and SIMFUT_CLIM, and the difference (b, d, f) between SIMFUT and SIMPRES, SIMFUT_CLIM and SIMPRES, and SIMFUT and SIMFUT_CLIM. Grey shaded areas indicate regions with less than 95% significance. [Fig. 3 of Pfister et al., 2014]
Reference: Pfister, G. G., S. Walters, J.-F. Lamarque, J. Fast, M. C. Barth, J. Wong, J. Done, G. Holland, and C. L. Bruyère (2014), Projections of future summertime ozone over the U.S., J. Geophys. Res. Atmos., 119, doi:10.1002/2013JD020932. [http://onlinelibrary.wiley.com/doi/10.1002/2013JD020932/full]
NCAR Press Release:
http://www2.ucar.edu/atmosnews/news/11540/climate-change-threatens-worse...