New ozonesonde climatology between 1995 and 2009
A new ozonesonde climatology for the period 1995-2009 was compiled for model evaluation and comparison to other observations [Tilmes et al., 2011]. This climatology allows evaluating the performance of ozone especially in the troposphere and lower stratosphere. Various models still show significant shortcomings to reproduce the structure and seasonality of ozone, one of the most important trace gases in the atmosphere. The climatology is available to download at: https://acomstaff.acom.ucar.edu/tilmes/ozone.html
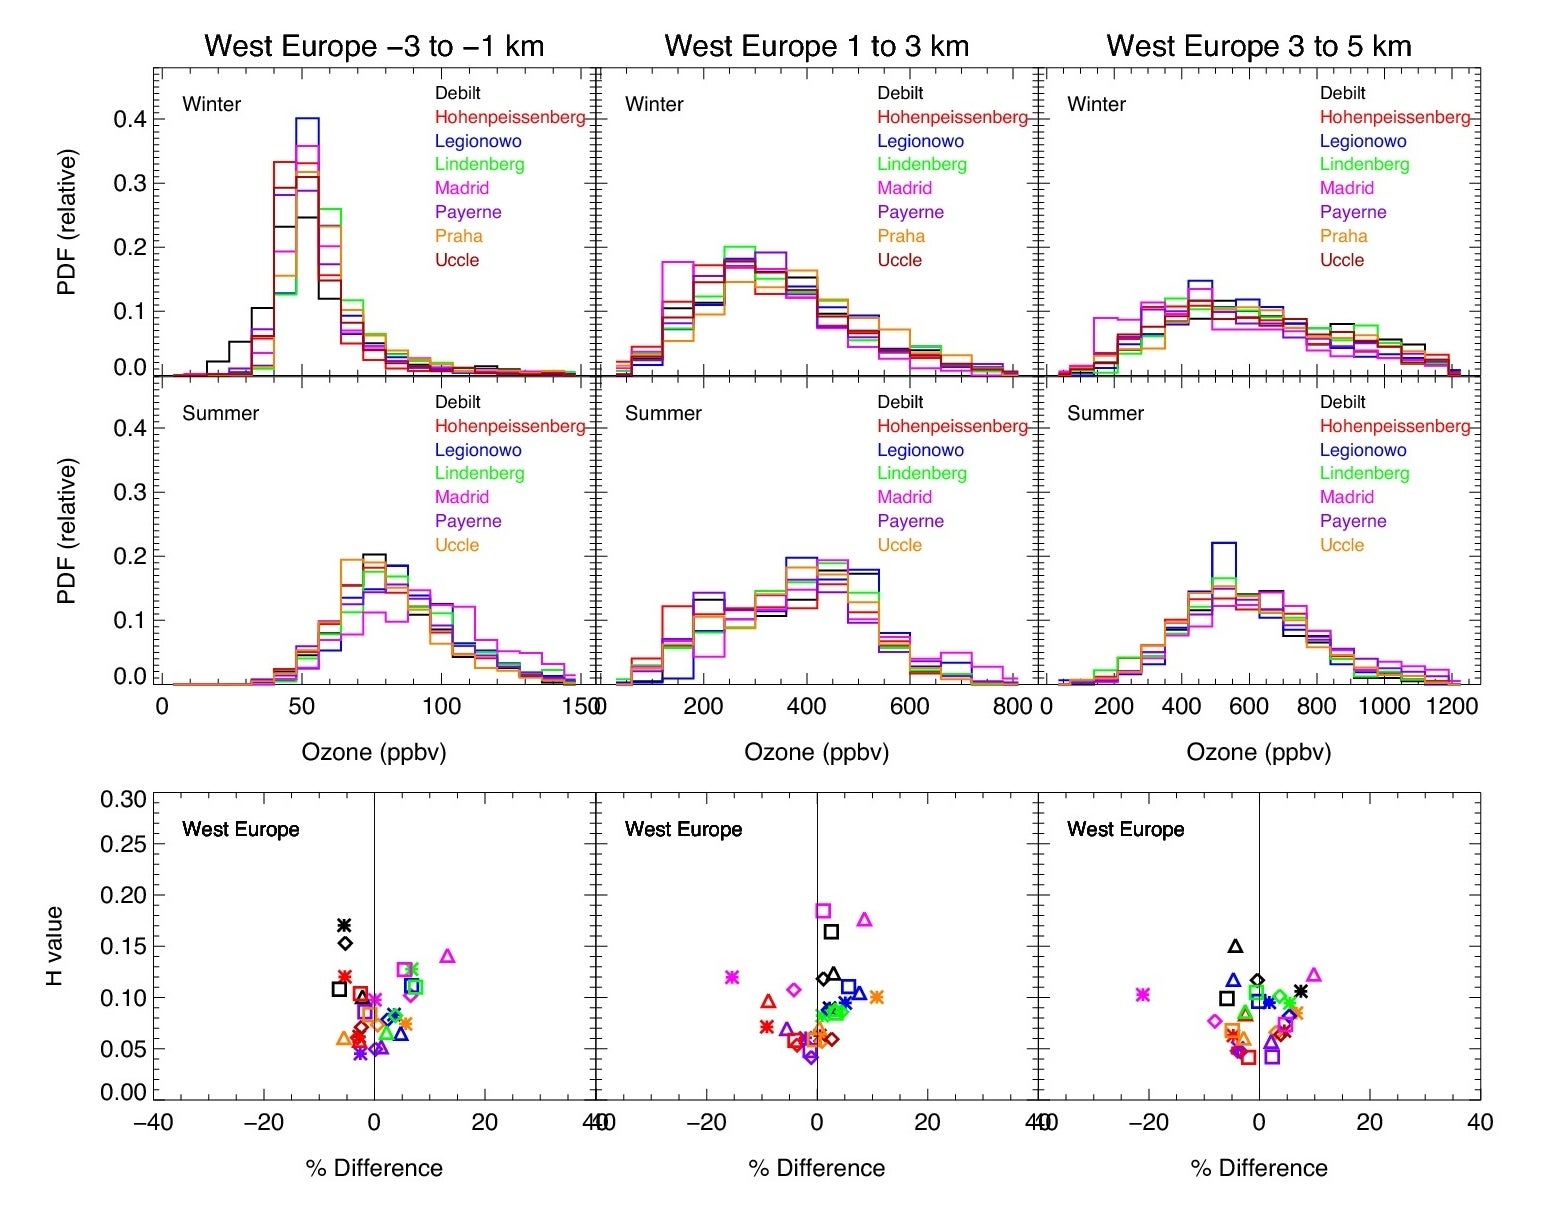
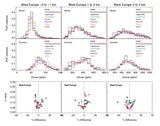
Figure 1. Top and middle row: probability distribution function (PDF) of UTLS ozone for different stations within West Europe (different colors) for winter (top) and summer (middle) with regard to the thermal tropopause. Bottom panel: Hellinger Distance (measure for the similarity of two distributions) between the ozone distribution of single stations and the regionally-aggregated distribution versus the median differences of the two distributions, shown for all stations (different colors) and seasons (winter: asterisks, spring: diamonds, summer: triangles, fall: squares). Distribution samples are from the vertical regions 1-3 km below the tropopause (left), 1-3 km above the tropopause (middle) and in 3-5 km above the tropopause (right).
References:
Tilmes, S., J.-F. Lamarque, L. K. Emmons, A. Conley, M. G. Schultz, M. Saunois, V. Thouret, A. M. Thompson, S. J. Oltmans, B. Johnson, and D. Tarasick (2011): Ozonesonde climatology between 1995 and 2009: Description, Evaluation and Applications, Atmos. Chem. Phys. Discuss., 11, 1–49, 2011, doi:10.5194/acpd-11-1-2011