HOx Observations
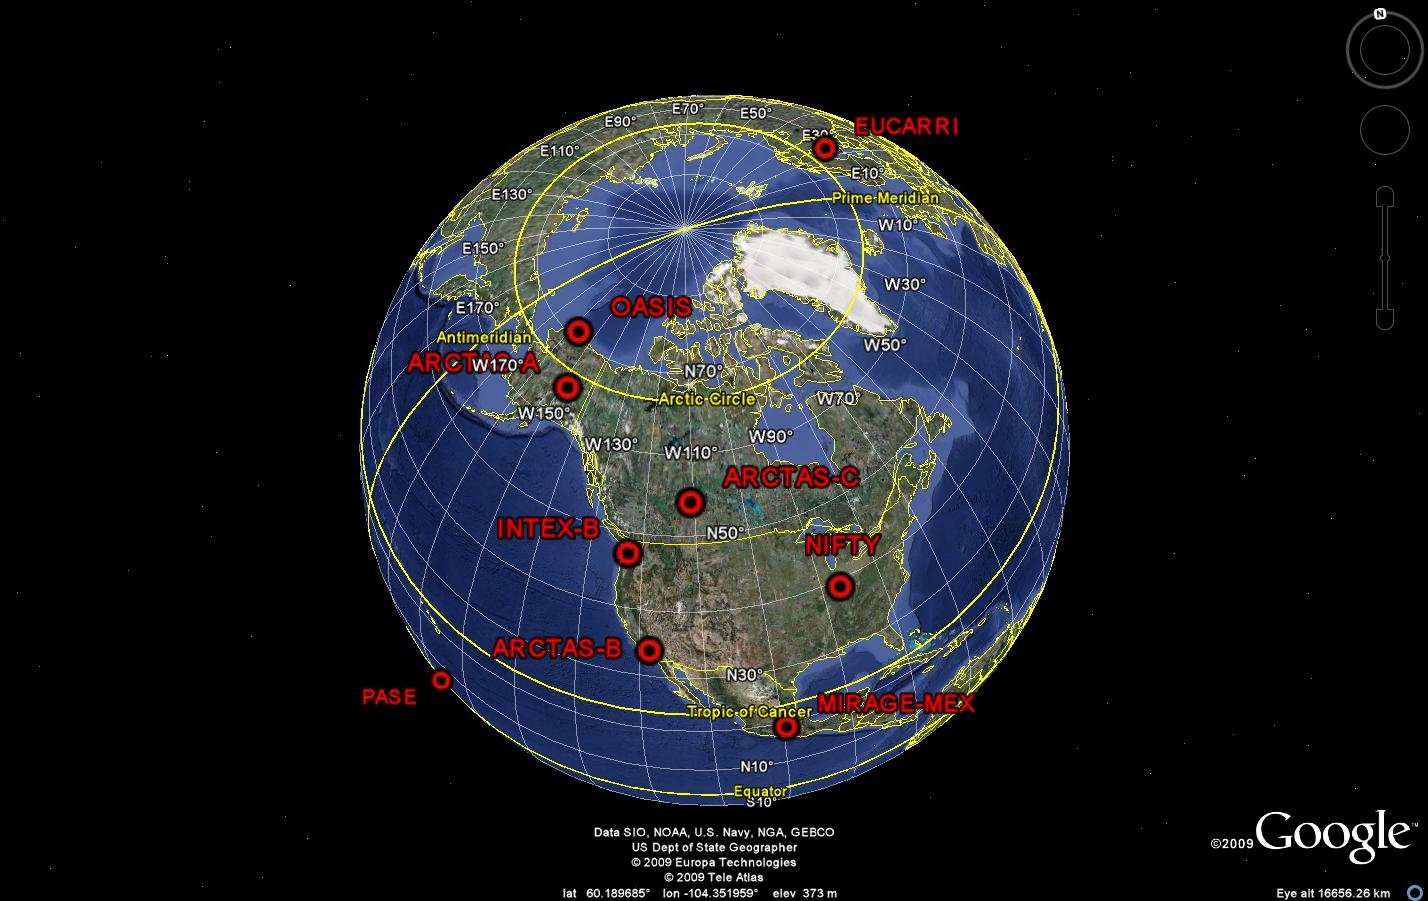
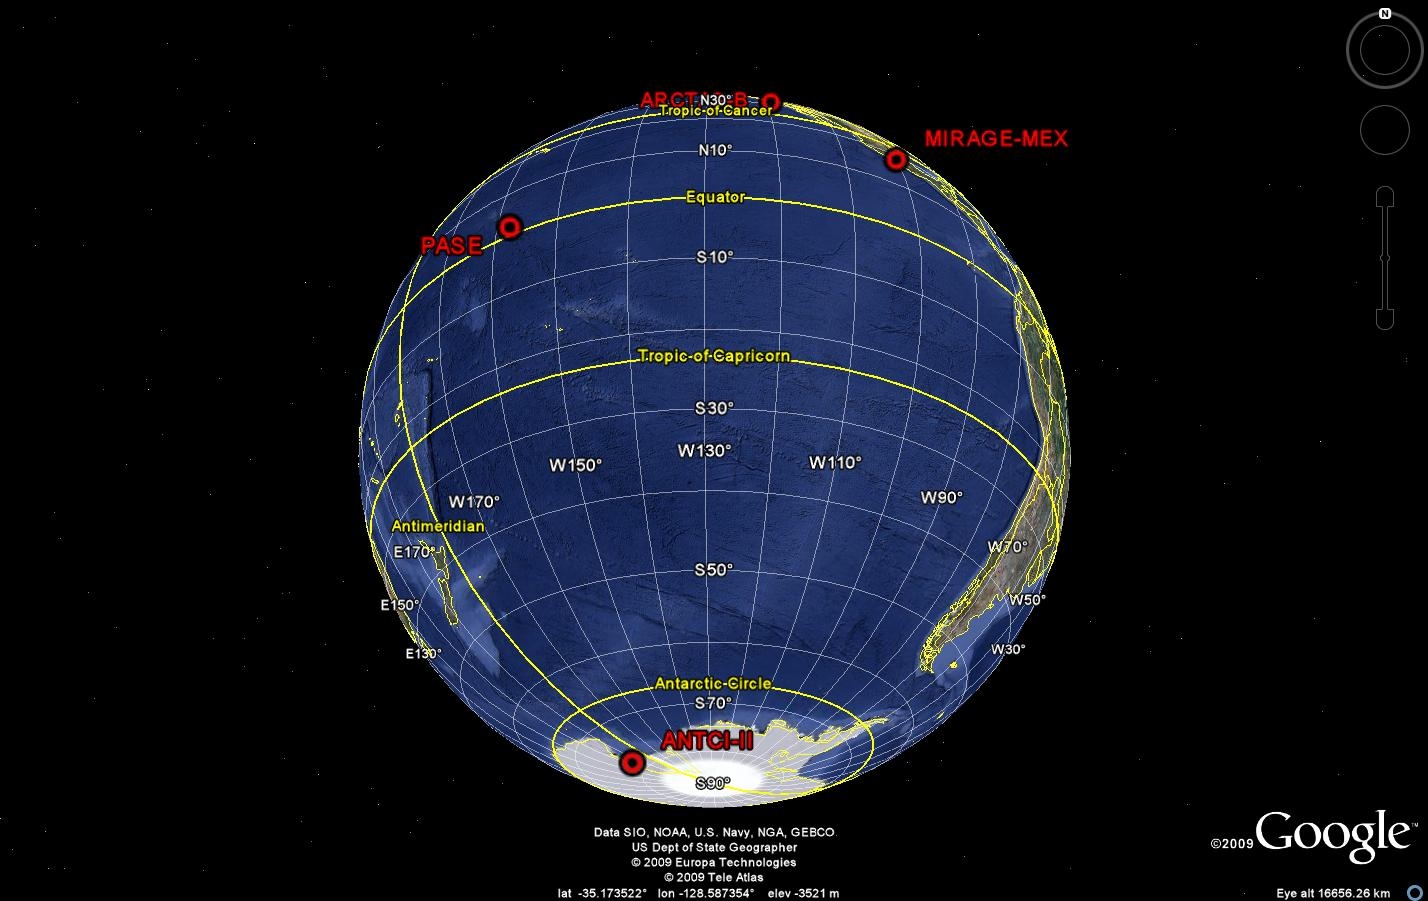
Figure 1: Locations of recent measurement campaigns that involved POP group observations. Right-click to view larger images.
Over the past 4 years, the POP group has made observations of OH, H2SO4, HO2, HO2+RO2 and OH reactivity at a number of sites around the globe (Figure 1). These measurements contribute to our understanding of the oxidizing capacity of the atmosphere, and the impact of natural and anthropogenic activities on its capability to cleanse itself. These campaigns are summarized in Table 1.
Table 1. Recent campaigns involving CIMS-based HOx and H2SO4 observations.
| Name | Dates | Location | Platform | Purposes |
|---|---|---|---|---|
| ANTCI-II | Dec 2005 | McMurdo Station | Twin Otter | transport & chemistry over Antarctic plateau |
| MIRAGE/MILAGRO | March 2006 | Veracruz, Mexico | C-130 | Mexico City outflow |
| INTEX-B | Apr-May 2006 | Seattle, WA | C-130 | Asian outflow at long range |
| Niwot Ridge Aerosols | Sep 2006 | Colorado | surface | Aerosol nucleation |
| EUCARRI | May 2007 | Hyytiala, Finland | surface | Aerosol nucleation |
| PASE | Aug-Sep 2007 | Christmas Island | C-130 | DMS oxidation |
| ARCTAS-A | April 2008 | Fairbanks, AK | DC-8 | Long range transport |
| NIFTY | May 2008 | Bloomington, IN | surface | Aerosol nucleation and growth |
| ARCTAS-B | June 2008 | Palmdale, CA | DC-8 | California air quality |
| ARCTAS-C | July 2008 | Cold Lake, AB,CAN | DC-8 | Biomass burning emissions |
| OASIS | Feb-Apr 2009 | Barrow, AK | Surface | Ozone depletion events |
Acronyms: ANTCI II: Antarctic Tropospheric Chemistry Investigation, Part 2; MIRAGE: Megacities Impacts on Regional and Global Environment; INTEX-B: Intercontinental Chemical Transport Experiment, Phase B; PASE: Pacific Atmospheric Sulfur Experiment; ARCTAS: Arctic Research of the Composition of the Troposphere from Aircraft and Satellites, Phases A, B and C; NIFTY: Nucleation In ForesTs.
Analysis of data from these campaigns is currently a high priority activity for our group. Some findings of these analyses are discussed below.
 |
 |
 |
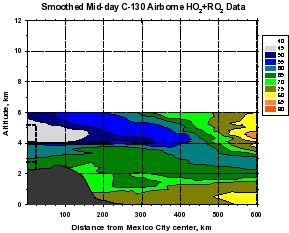 |
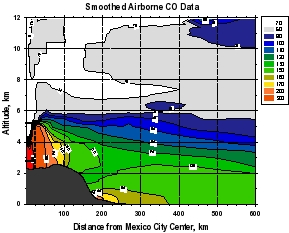
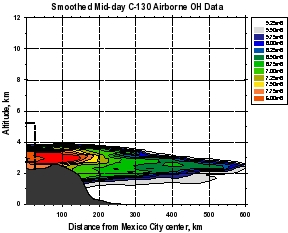
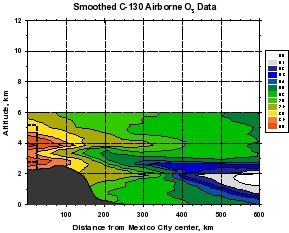
Figure 2: Smooth contour plots of airborne observations from MIRAGE-MEX of (a) CO, (b) OH, (c) O3, and (d) HO2+RO2 versus downwind distance and altitude. Plot (a) incorporates C-130 and DC-8 data, while the other three use C-130 data only. The dotted lines show the horizontal extent of the Mexico City metropolitan area, and the vertical extent of the mixed layer. The unique geographical extent of these data allow examination of the evolution (dilution and chemical reaction) of the Mexico City emissions as they move downwind within about 1 day. The relative unreactivity of CO over this time scale makes it valuable as a measure of dilution, which can then be separated from the chemistry taking place during transport. Note that OH levels are very high just outside of the Mexico City metropolitan area (around 8 x 106 cm-3) that decreases rapidly to values less than 4 x 106 cm-3. Peroxy radicals (HO2+RO2), on the other hand are lower in the vicinity of Mexico City and increase downwind. Ozone displays an unusual behavior of higher values near the upper and lower boundaries of the plume, and smaller values in the plume center.
 |
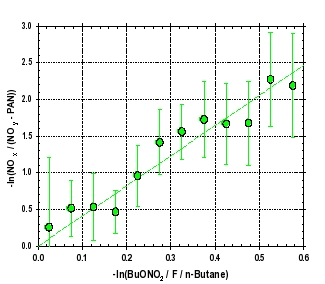 |
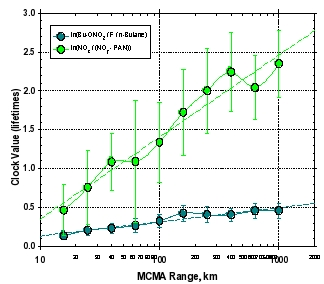
Figure 3: Comparisons of two photochemical “clocks” (out of many than have been studied) versus the downwind distance from Mexico City (a), and two clocks versus each other. The dark green circles show the evolution of the ratio of 2-butyl-nitrate versus n-butane corrected by a factor (F) that accounts for OH attack on the #2 carbon position and the branching of butyl peroxy radicals to form butyl-nitrate. The value for F is 0.1. The light green circles show the ratio of NOx (NO + NO2) versus NOy (sum of all reactive nitrogen) minus PAN (peroxyacetylnitrate). The units for each of these clocks are lifetimes of the reacting species (n-butane and NO2, respectively). The lifetime of NO2 is about 4.3 times shorter than n-butane for MIRAGE-MEX conditions, which is confirmed by the slope of best fit line in panel (b).
 |
 |
 |
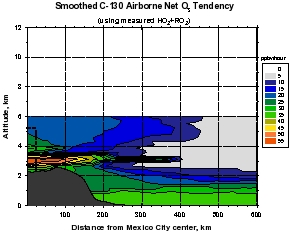 |
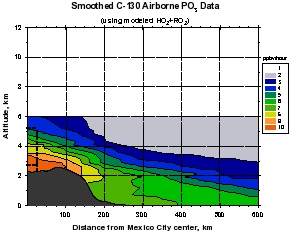
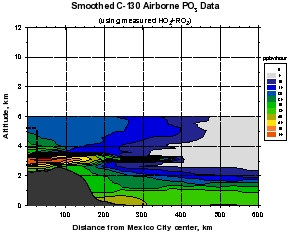
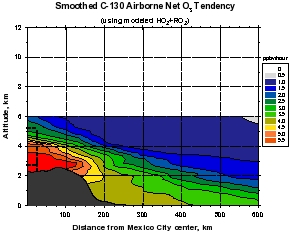
Figure 4: Calculations of gross ozone production (top panels) and net ozone production (gross production minus loss, lower panels) calculated from MIRAGE-MEX observations (right panels), and calculated using peroxy radical concentrations from a constrained steady state model (left panels). Note that the model values for net ozone production range from about 5 ppbv per hour on the continental plateau to values of 1-2 ppbv per hour 1 day downwind. Using the observations of peroxy radicals yield significantly larger values of 50 and 5-20 ppbv per hour, respectively. The measure-model discrepancy is still being studied, but is related to higher than expected peroxy radical concentrations at relatively high NOx concentrations.
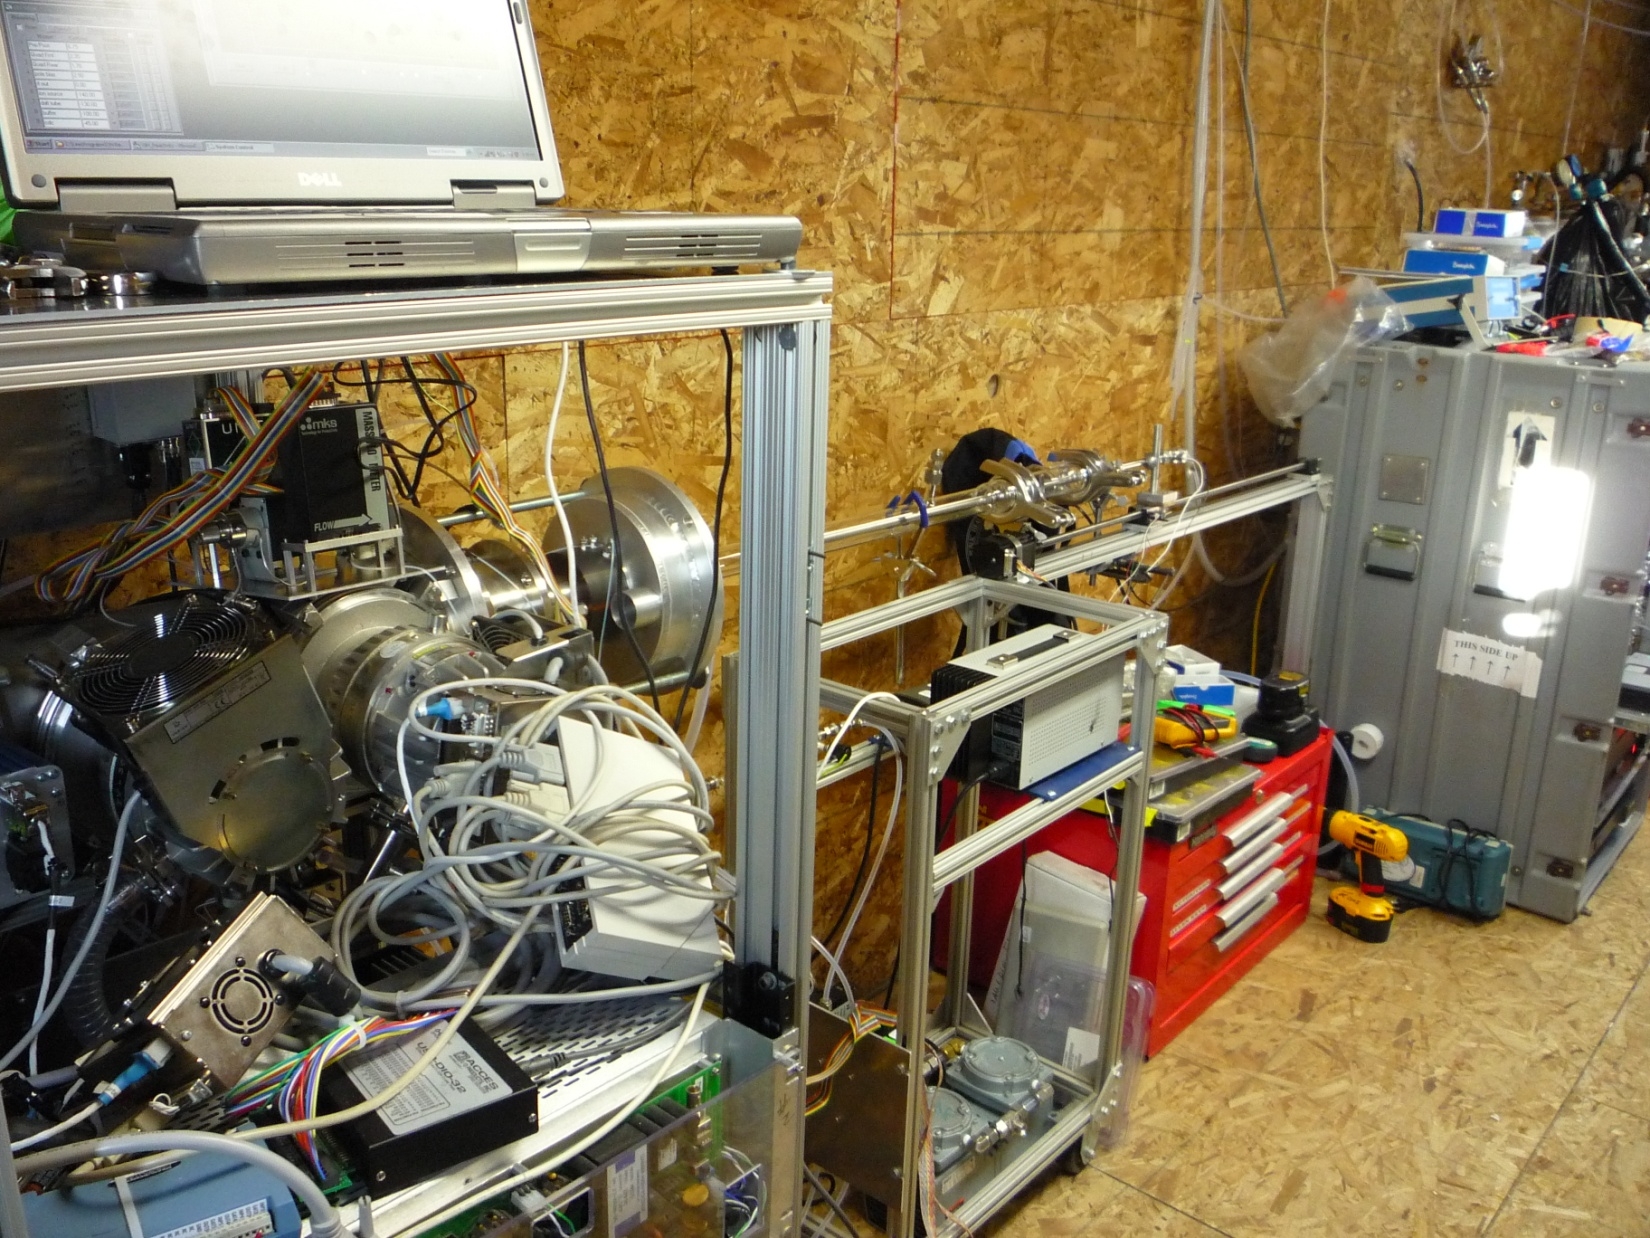
Figure 5: Photo of the OH reactivity instrument as configured during OASIS. Ambient air is drawn though a glass flow tube and mixed with OH produced in an injector. The OH remaining (measured by the selected ion CIMS instrument on the left) versus reaction time is used to derive the total reactivity of species in the air toward OH, and is used to close the budget of OH in combination with ambient OH measurements and measurements of processes producing OH (e.g. photolysis of ozone in the UVB spectral region).
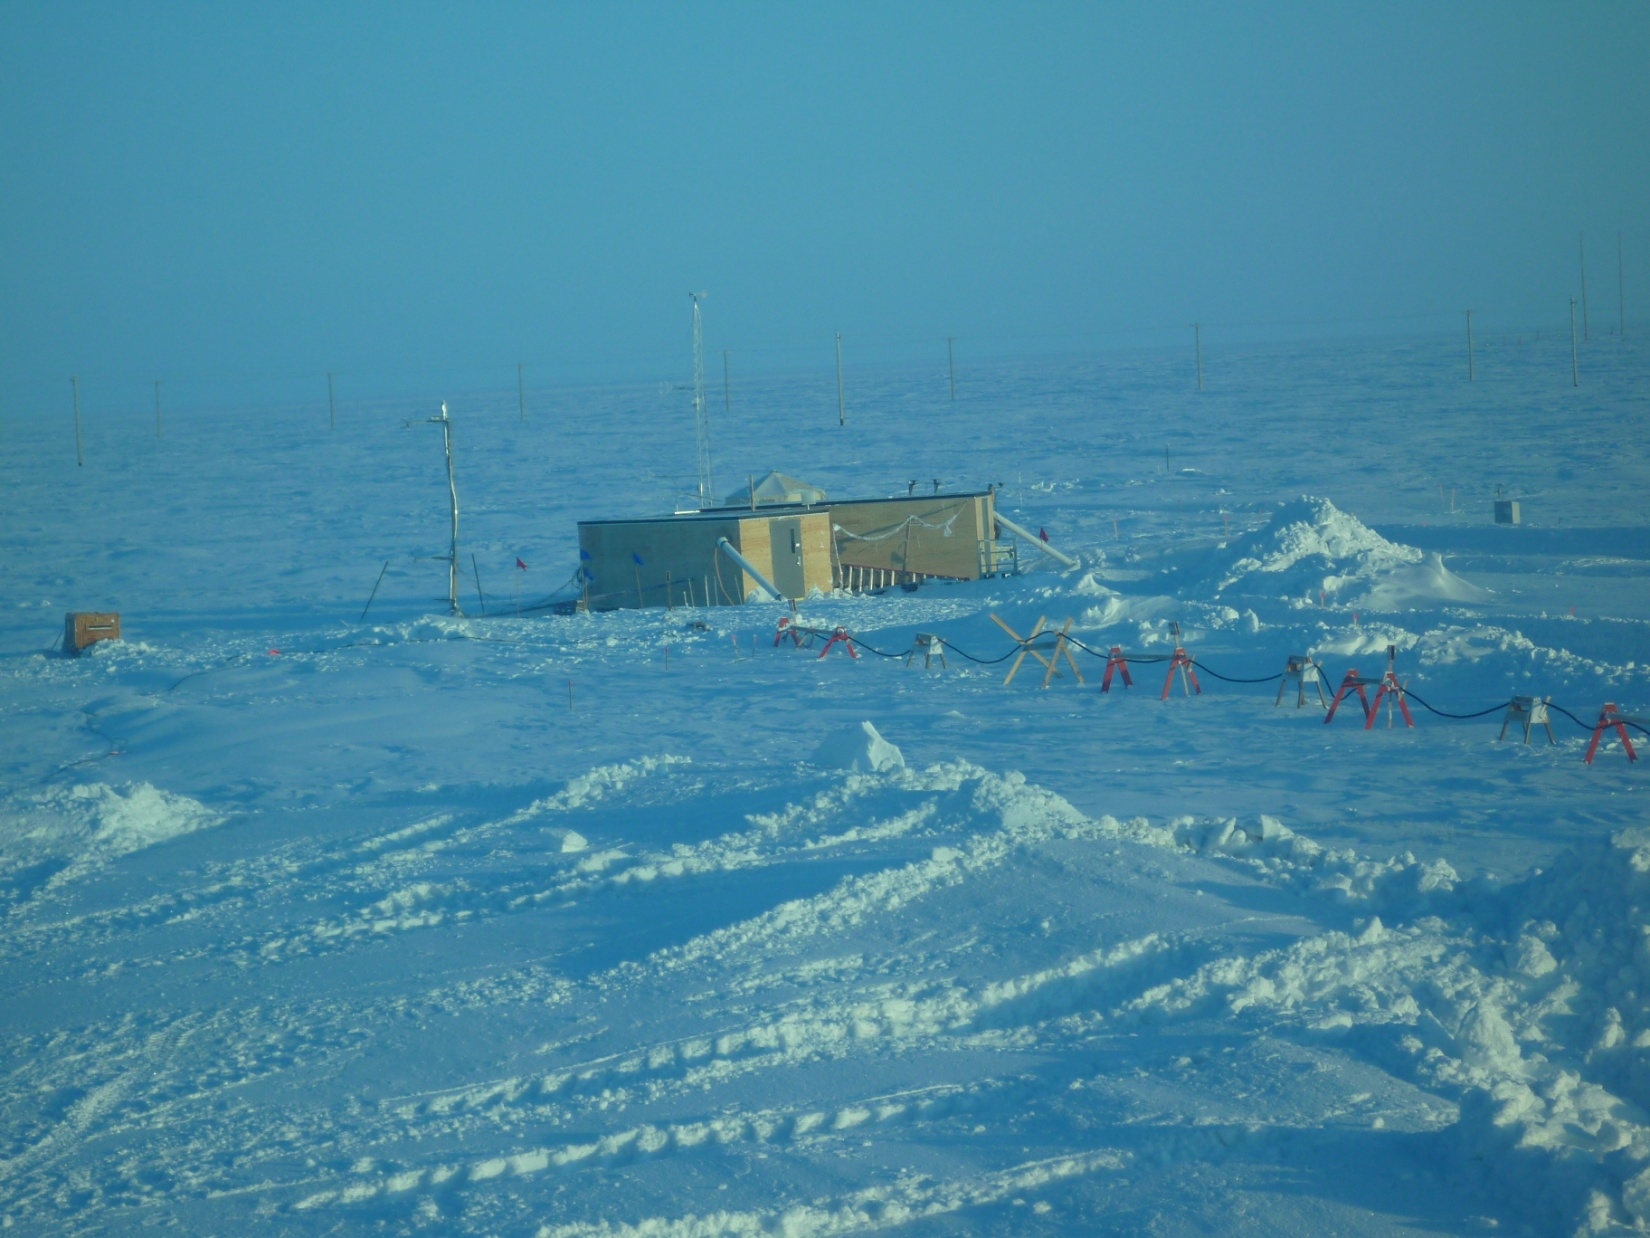
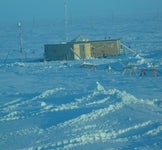
Figure 6: Photo of trailers housing the instruments at the main measurement site for OASIS Barrow 2009. Airflow was often from the northeast (left in the photo) off of the Arctic Ocean. For some species, vertical gradients were measured from towers and balloons. In addition to measurements of gas and particle phase properties, the characteristics of the snow and ice were also studied. Several ozone depletion events were captured during the study (see Figure 7).
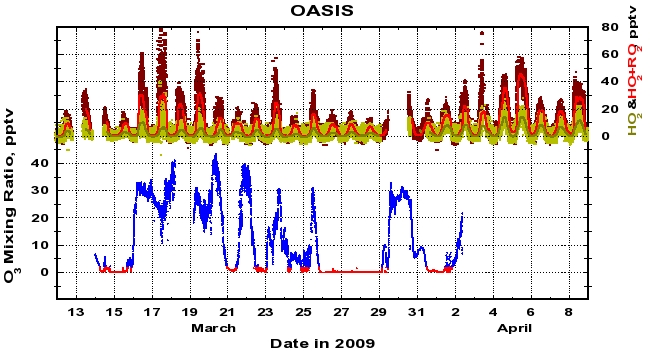
Figure 7: Ozone mixing ratios (lower) and peroxy radical mixing ratios (upper) near the Barrow 2009 site. The ozone mixing ratios are colored by values above 2 ppbv (blue) and less than 2 ppbv (red). HO2 one minute average mixing ratios are shown as yellow points, and smoothed with a running median (dark green line). HO2+RO2 one-minute average mixing ratios are shown as dark red points, and smoothed (red line).