A First Look at Air quality in Central Asia
Air pollution is a major societal and environmental threat that is occurring in many places across the world including Central Asia (CA). Yet this region is significantly understudied, which motivated Janyl Madykova to make this a topic for her research. Janyl is from Kyrgyzstan and came to the USA in 2018 as a Fulbright Scholar. In summer 2020 she virtually visited NCAR under a Muskie Internship Program collaborating with ACOM on exploring air quality in CA. Here is a brief summary of the work Janyl performed.
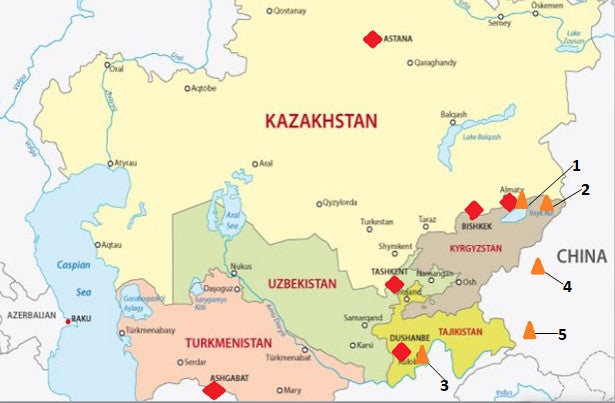
CA is located between China, Russia and the Caspian Sea and includes five countries: Kyrgyzstan, Uzbekistan, Kazakhstan, Tajikistan, and Turkmenistan (Figure 1). Complex topography, large arid regions exposed to strong winds, and anthropogenic sources affect the air quality in the region and lead to public health hazards. In order to understand air quality in CA, Janyl combined measurements and output from the NCAR global model CAM-Chem.
PM2.5 concentrations were retrieved from the US embassies monitors that were installed in 2018-2019 in the capitals of CA countries with a population between 800,000 - 2.5 million. Concentration patterns vary among different countries throughout the year depending on the seasons (Figure 2). Kyrgyzstan and Kazakhstan had the highest average PM2.5 concentrations in the winter, which is mostly related to emissions from fossil fuel use and biomass combustion. Uzbekistan and Tajikistan had different concentration patterns in comparison to Kyrgyzstan and Kazakhstan due to additional sources of fine particles, such as from dust storms. Overall, Turkmenistan had the lowest PM2.5 concentrations among CA countries throughout the year.
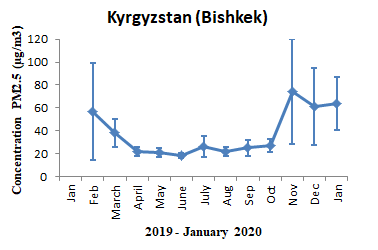
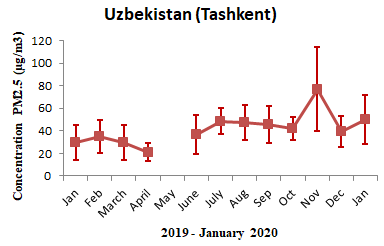
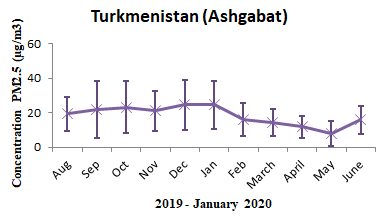
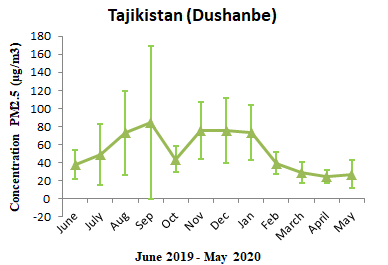
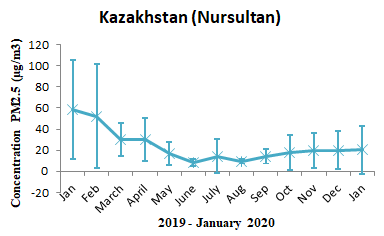
Monthly average concentrations and standard deviation of PM2.5 in CA countries 2019-2020
(Source: https://www.airnow.gov/international/us-embassies-and-consulates/).
In addition to surface measurements of PM2.5, the study focused on aerosol optical depth measurements (AOD) at two AERONET sites: Issyk-Kul, Kyrgyzstan and Dushanbe, Tajikistan (locations marked in Figure 1). The analysis at Issyk-Kul shows similar annual patterns over 2007 to 2016 with largest AOD values occurring in spring and fall (Figure 3). Maximum AOD (values > 0.3) was observed in spring 2012 and 2013. These two years were further analyzed to identify the possible sources that led to this increase.
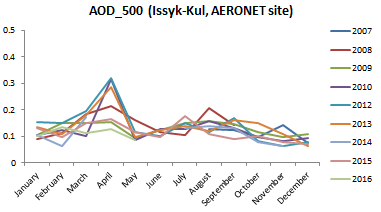
AOD measurements at the Issyk-Kul AERONET station from 2007 to 2016.
AERONET measurements of fine and coarse particle AOD (Figure 4) show that the coarse mode was dominant in spring 2012 and 2013. This is most likely due to dust storm events in the Taklamakan desert located in western China. It should be noted that the fall peak is also affected by coarse mode AOD which leads to the conclusion that dust transported from the Taklamakan desert impacts the east part of Kyrgyzstan especially in spring and fall. In contrast, the winter season in both 2012 and 2013 was dominated by fine mode AOD which is mostly related to emissions from fossil fuel use and biomass combustion.
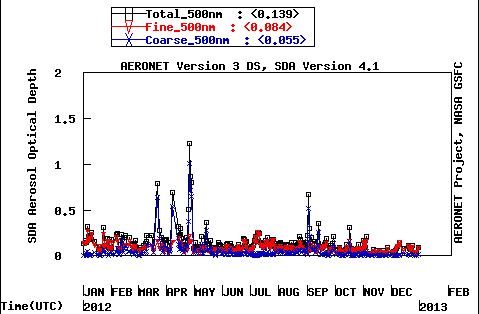
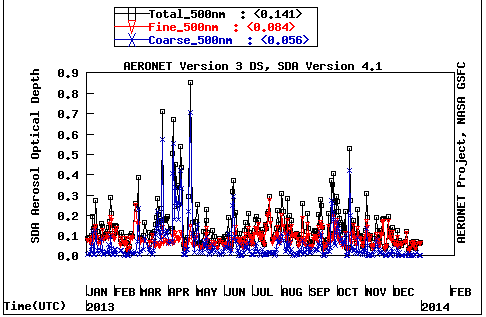
Fine/Coarse mode AOD for 2012 and 2013 at the Issyk-Kul AERONET site.
(Source: https://aeronet.gsfc.nasa.gov/cgi-bin/data_display_aod_v3)
AOD data from the Dushanbe station in Tajikistan (Figure 5) showed very different seasonal patterns and higher AOD compared to the Issyk-Kul station. This site shows highest values in summer and fall.
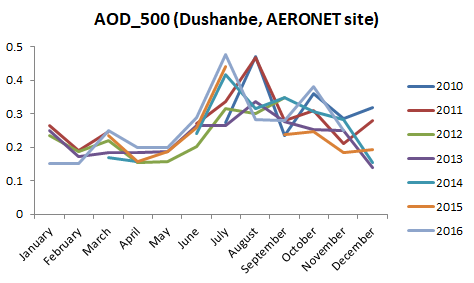
AOD measurements at the Dushanbe AERONET station from 2010 to 2016.
Further analysis of fine and coarse mode AOD for the years 2013 and 2016 (Figure 6) shows these peaks are also mostly related to coarse mode particles. This reflects the influence of dust from local sources such as the Aral Sea and long-range transport of dust from the Middle East and Sahara. Similar as was seen for the Issyk-Kul site, winter was dominated by fine mode AOD related to fossil fuel and biomass combustion.
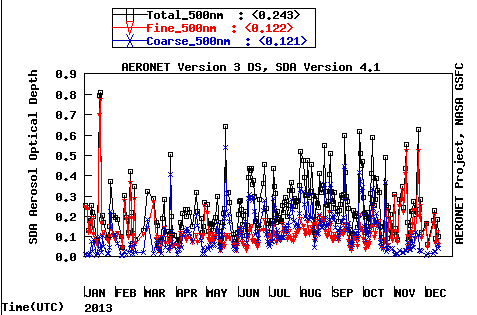
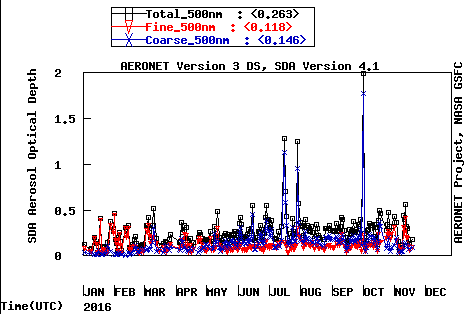
Fine/Coarse mode AOD for 2013 and 2016 at the Dushanbe AERONET site.
(Source: https://aeronet.gsfc.nasa.gov/cgi-bin/data_display_aod_v3)
In addition to AERONET AOD measurement, satellite data (MODIS onboard Terra satellite) and output from CAM-Chem were used to compare the results for the whole period at Issyk-Kul and Dushanbe AERONET sites (Figure 7). While the patterns are overall similar, some notable differences are evident. The model simulated AOD well at the Dushanbe station, however at the Issyk-Kul site the modeled AOD during July-October shows significantly higher peaks compared to the measurements in some of the year pointing to uncertainties in the CAM-Chem dust module.
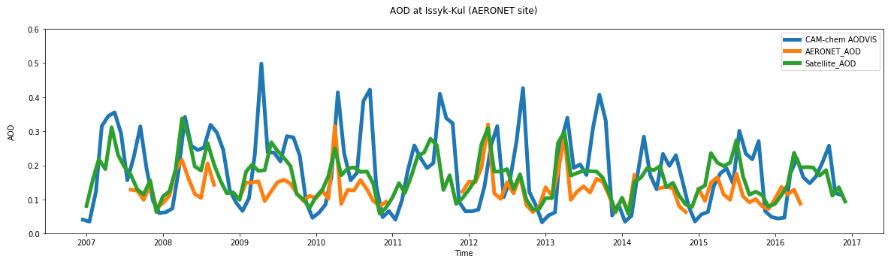
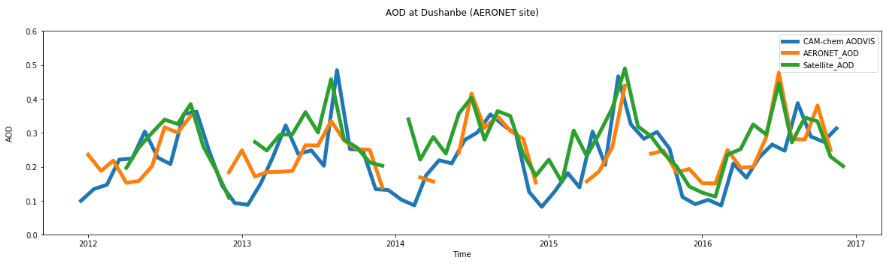
Comparison of AOD from CAM-Chem, AERONET measurements and satellite data at the Issyk-Kul and Dushanbe AERONET sites for 2007-2017.
This preliminary and ongoing analysis of AERONET AOD observations in Kyrgyzstan and Tajikistan demonstrate the importance of desert dust that contributes to air pollution in the region; however, little observational evidence is available and more observational stations are needed to better characterize the impact of desert dust on air quality in CA and put this into relation to anthropogenic sources.
by Janyl Madykov, August 2020.
