ENSO and WACCM
El Nino-Southern Oscillation (ENSO) is the largest source of interannual variability in the tropical troposphere. Some studies have documented the propagation of the ENSO signal to the stratosphere (Calvo Fernandez et al., 2004; Sassi et al., 2004; Garcia-Herrera et al. 2006) through the anomalous propagation and dissipation of ultralong Rossby waves at middle and high latitudes, which modify the stratospheric mean meridional circulation. A recent study using the Whole Atmosphere Community Climate Model (WACCM3.5), has also shown the intensification of the tropical upwelling in the lowermost part of the stratosphere, below 20km, during warm ENSO events and its weakening during the opposite phase (Calvo et al. 2010). This is mainly due to anomalous forcing by orographic gravity waves especially during the strongest warm ENSO episodes; as a result of anomalies in the location and intensity of the subtropical jets and in the meridional gradient of temperature observed during ENSO episodes.
|
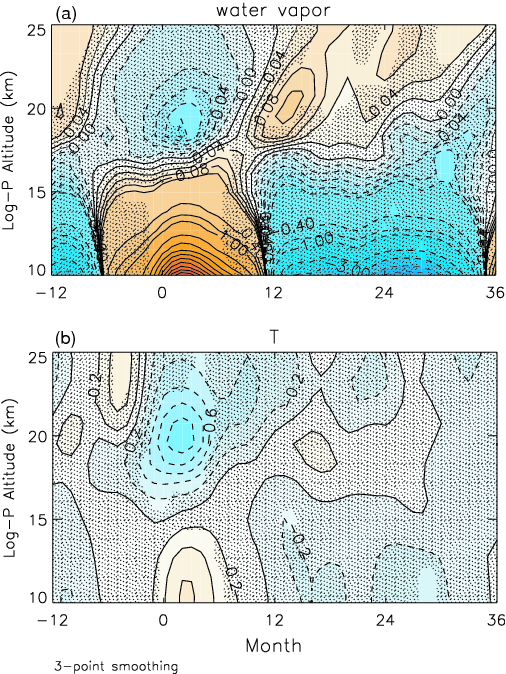
ENSO events in WACCM are also associated with anomalies in the distribution of water vapor, both in the troposphere and the stratosphere. Figure A shows the temporal evolution (from month -12 to month +36; month 0 indicates the maximum of the ENSO index in sea surface temperatures, Nino3.4) of the composite of water vapor anomalies during warm ENSO events. Enhanced water vapor in the troposphere and reduced water vapor in the lower stratosphere are simulated during the peak ENSO months (e.g. 0-3). These reduced values in the stratosphere presumable follow from the colder temperature in the lowermost stratosphere that accompanied warm ENSO events (Figure B). However, in the year following the peak of the warm ENSO event, the water vapor anomaly in the stratosphere becomes positive and remains that way for 1-2 years thereafter. This delayed moistening does not seem to be related to anomalies in the cold point temperature, as the temperature composite hardly shows any signal in the stratosphere after month 6 of the warm ENSO peak (Figure B). It seems related to the upward and equatorward injection of water vapor by the circulation associated with the northern summer monsoon (cf. Park et al. 2004).
To our knowledge this behavior has not been documented in observations but has the potential to introduce low-frequency variability in water vapor time series that could confound the estimation of secular trends.
References
Calvo Fernandez, N., R. Garcia, R. Garcia Herrera, D. Gallego Puyol, L. Gimeno Presa, E. Hernandez Martin, and P. Ribera Rodriguez, 2004: Analysis of the ENSO signal in tropospheric and stratospheric temperatures observed by MSU, 1979–2000. J. Climate, 17, 3934–3946.
Sassi, F., D. E. Kinnison, B. A. Boville, R. R. Garcia, and R. R. Roble, 2004: Effect of El Nino–Southern Oscillation on the dynamical, thermal, and chemical structure of the middle atmosphere. J. Geophys. Res., 109, D06101, doi:10.1029/2003JD004012.
Garcia-Herrera, R., N. Calvo, R. R. Garcia, and M. A. Giorgetta, 2006: Propagation of ENSO temperature signals into the middle atmosphere: A comparison of two general circulation models and ERA-40 reanalysis data. J. Geophys. Res., 111, D06101, doi:10.1029/2005JD006061.
Calvo, N., R.R. Garcia, W.J. Randel and D. R. Marsh, 2010: Dynamical Mechanism for the Increase in Tropical Upwelling in the Lowermost Tropical Stratosphere during warm ENSO events. Journal of the Atmospheric Sciences. DOI: 10.1175/2010JAS3433.1.
Park, M., W. J. Randel, D. E. Kinnison, R. R. Garcia, and W. Choi, 2004: Seasonal variation of methane, water vapor, and nitrogen oxides near the tropopause: Satellite observations and model simulations. J. Geophys. Res., 109, D03302, doi:10.1029/2003JD003706.