Cloud Tops and Tropopause
The tropopause is a fundamental boundary of the atmosphere, separating the turbulent mixing dominated troposphere from the much more stable and stratified stratosphere. To examine the role of the tropopause and the jet streams in constraining the cloud distributions, ACD scientists performed an analysis of cloud top and tropopause relationships using the Cloud-Aerosol Lidar Infrared Pathfinder Satellite Observations (CALIPSO) cloud data and National Centers for Environmental Prediction (NCEP) Global Forecast System (GFS) tropopause data. Figure 1 provides an example of a CALIPSO attenuated back-scatter cross section with co-located tropopause and wind field based on the NCEP GFS data, and a monthly cloud top occurrence frequency in tropopause relative coordinates. This example shows that there is a strong correlation of cloud top and the tropopause.
This type of analyses is performed on a global scale using four years (2006-2010) of CALIPSO 5 km resolution cloud layer data. The results show that the thermal tropopause appears to be a significant constraint for the cloud top. The zonal vertical distribution of cloud tops in tropopause relative coordinates show a maximum at the tropopause level for both the tropics (20°S-20°N) and midlatitudes (40°-60°S, 40°-60°N) for all four seasons. Occurrence of cloud tops above the tropopause is examined and quantified. The results show that, with the consideration of tropopause height uncertainty, the data do not provide sufficient evidence of significant presence of cloud tops above the tropopause in the midlatitudes. In the tropics, the significant occurrences of cloud top above the thermal tropopause are found in regions known for seasonal deep convection. In most cases, the occurrence is up to 24% in 2°x3° latitude-longitude bins with isolated higher frequencies in the western Pacific during the northern hemispheric winter season. The vertical distributions show that these events are mostly up to 2.5 km above the lapse rate tropopause, which is comparable to the differences between the lapse rate and the cold point tropopause in regions of active convection. We speculate that this separation may be responsible for a significant fraction of the cloud tops that do occur above the lapse rate tropopause in our analyses. It is also important to note that our results are limited by the CALIPSO twice-daily sampling with local equator crossing times of 01:30 and 13:30. The data therefore do not provide a good representation of convection over land, which is known to have maxima in afternoon local times. The tropopause determination is a significant component of this type of studies and errors in the tropopause height may lead to significantly different conclusions.
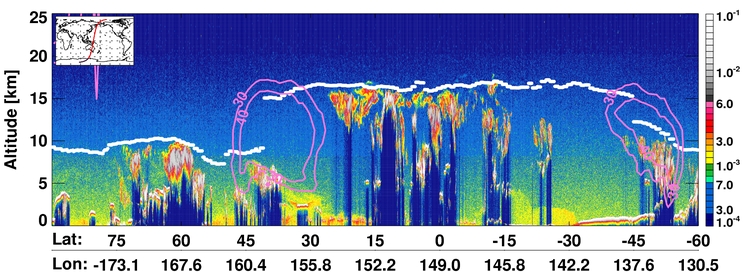
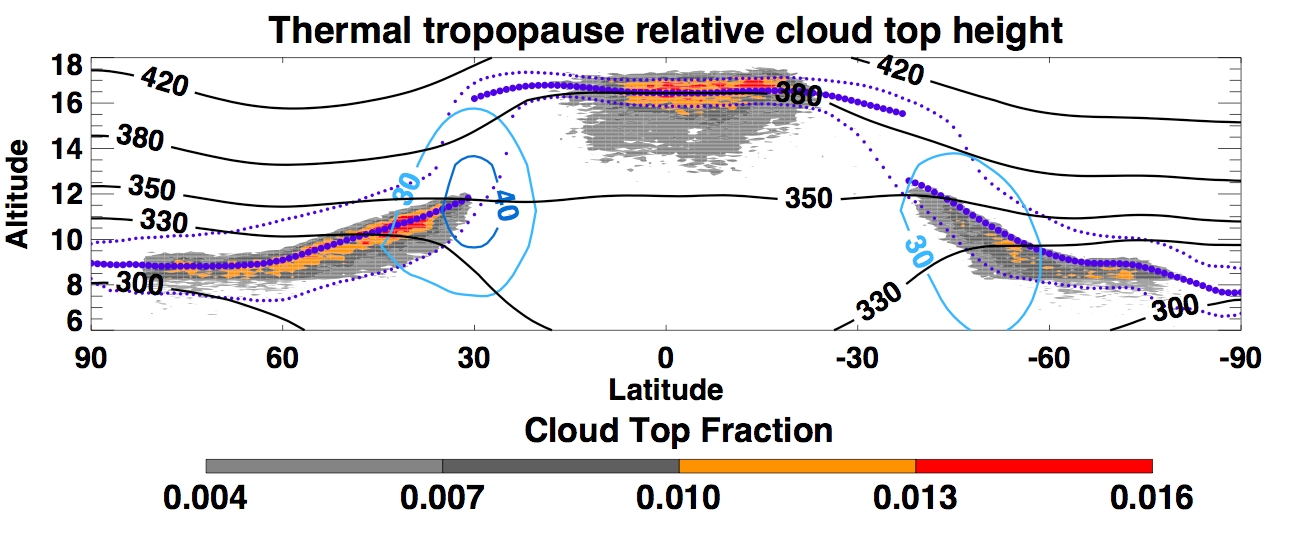
Figure 1. (Upper) CALIPSO 532 nm LIDAR attenuated backscatter for a descending orbit on 13 March 2007 with equator crossing near 150° E and the meteorological background including the tropopause height (white dots) and jet stream locations based on wind speed (pink contours). (Lower) Vertical distribution of the cloud top fractions calculated in altitude bins relative to the thermal tropopause. Also shown are the zonal mean tropopause height (large purple dots) and its 10th and 90th percentiles (small purple dots), zonal mean horizontal wind speed (blue contours for 30 and 40 m/s), and zonal mean potential temperature surfaces (black lines). The data included in the statistics are from March 1 – March 31, 2007. The meteorological fields are from the GFS data.
Click on either figure for larger image.
References
Pan L. L., and L. A. Munchak, The Relationship of cloud top to the tropopause/jet structure from CALIPSO data, submitted to J. Geophys. Res., doi:10.1029/2010JD015462.