Near-global variability of stratospheric water vapor observed by SAGE III/ISS
Water vapor in the stratosphere plays an important role in the Earth’s changing climate through positive feedbacks in relation to the global temperature. With the chemical and dynamical environment of the stratosphere continuously evolving, accurate measurements of global water vapor are one of the critical elements in predicting the future climate. The Stratospheric Aerosol and Gas Experiment III instrument on the International Space Station (SAGEIII/ISS) has been measuring water vapor, aerosols, and ozone using the solar occultation technique since 2017. The high vertical resolution (~2 km) measurements from SAGE III/ISS capture the well-known seasonal variations in water vapor including the vertically propagating “tape-recorder” in the tropical lower stratosphere. We found overall excellent agreement between SAGE III/ISS and the Aura Microwave Limb Sounder (MLS) measurements in terms of seasonal mean structure and large-scale variability in the lower to mid stratosphere.

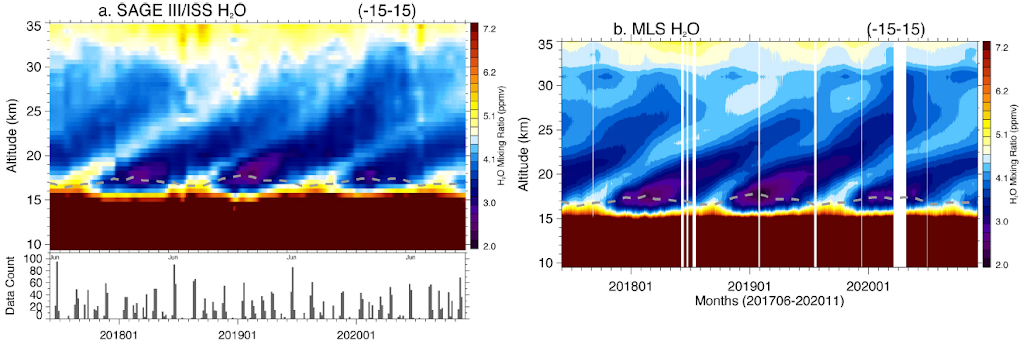
The wet phase of the tropical “tape-recorder” is linked to the water vapor maxima over the Northern Hemispheric (NH) summer monsoons. Interannual variability over the relatively short data record show large year-to-year variations in the NH summer monsoons as well as in the tropical lower stratosphere between 16 and 30 km. For instance, August 2017 shows higher water vapor and colder average temperatures over the North American (NA) monsoon, compared to August 2018. The wet phase of the “tape-recorder” during 2017 shows higher water vapor mixing ratios compared to 2018 as shown in Figure 1. The seasonal and interannual variations in water vapor are largely controlled by the tropopause temperatures in the tropics. As a result, relative humidity (RH) is between ~40%-70% near the tropical cold point tropopause. We have used the high vertical resolution water vapor data from SAGE III/ISS together with co-located MERRA-2 temperatures to evaluate large-scale RH behavior in the tropics.

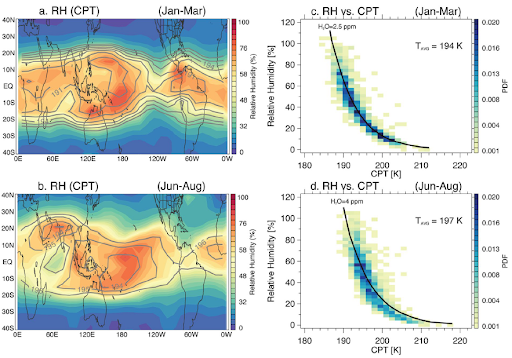
Time average maps of RH at the cold point for the NH winter (cold) and summer (warm) seasons show seasonally evolving maxima following the lowest temperature over the Western Pacific in winter (Figure 2a) and over the Central Pacific and Asian monsoon region in summer (Figure 2b). The localized RH maximum over the cold southern flank of the Asian monsoon region is consistent with this region controlling water vapor in the Asian monsoon by horizontal circulation through the cold region (Randel et al., 2015). Statistical relationships between RH and CPT temperature for the two seasons (Figures 2 c and d) demonstrate compact relationships between RH and CPT, with high RH occurring in the coldest regions in both the seasons. In NH winter (Figure 2c), the distribution closely follows the constant water vapor mixing ratio curve (2.5 ppm). In NH summer (Figure 2d), the RH distribution flows higher water vapor mixing ratio curve (4 ppm) and shows compact relationship similar to the NH winter.
For more information about SAGE III/ISS and this study, read the short article published here: https://www.nasa.gov/feature/langley/studying-earth-s-stratospheric-water-vapor
References:
Park, M., Randel, W. J., Damadeo, R. P., Flittner, D. E., Davis, S. M., Rosenlof, K. H., et al. (2021). Near-global variability of stratospheric water vapor observed by SAGE III/ISS. Journal of Geophysical Research: Atmospheres, 126, e2020JD034274. https://doi.org/10.1029/2020JD034274
Davis, S. M., Damadeo, R., Flittner, D., Rosenlof, K. H., Park, M., Randel, W. J., et al. (2021). Validation of SAGE III/ISS solar water vapor data with correlative satellite and balloon-borne measurements. Journal of Geophysical Research: Atmospheres, 126, e2020JD033803. https://doi.org/10.1029/2020JD033803