Modeling and Analysis of ATom Field Campaign Data
The NASA Atmospheric Tomography (ATom) mission on the DC-8 aircraft provided unprecedented global-scale characterization of atmospheric gaseous and aerosol constituents over the remote Pacific and Atlantic Oceans. The measurements span all four seasons, i.e. Northern Hemisphere summer (ATom-1, August 2016), winter (ATom-2, February 2017), fall (ATom-3, October 2017) and spring (ATom-4, May 2018). ACOM scientists provided key measurements of a wide range of gaseous VOCs with the Trace Organic Gas Analyzer (TOGA, led by Eric Apel, Rebecca Hornbrook, and Alan Hills), as well as measurements of photolysis frequencies, and spectrally resolved down- and up-welling actinic fluxes using the Charged-coupled device Actinic Flux Spectroradiometer (CAFS, led by Samuel Hall, and Kirk Ullmann). These measurements have been used in a number of collaborative studies to examine atmospheric processes such as the role of the gas-phase autoxidation in the dimethyl sulfide processing in the marine atmosphere, oxidation reactions in the remote free troposphere, the ubiquity of aged smoke in the remote troposphere (Schill et al., 2019), the occurrence of enriched uranium aerosols (Murphy et al., 2018), the emissions of short-lived halocarbon over the Southern Ocean (Asher et al., 2019), etc.
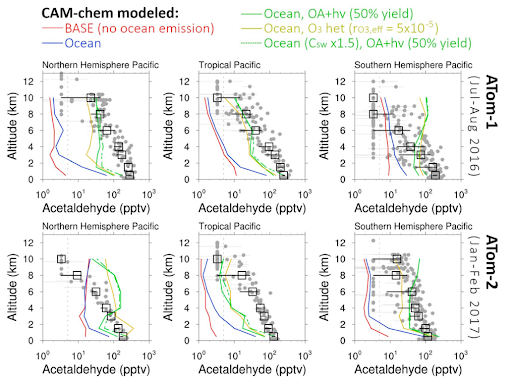
Several scientific discoveries led by the ACOM scientists have also been made in the past year using ATom measurements. Siyuan Wang (ASP/ACOM) and co-authors examined the budget of acetaldehyde using the CAM-chem model, and estimated that 34 Tg/a can be attributed to ocean emissions (Wang et al., 2019). They also reported that the observed levels of acetaldehyde in the remote free troposphere could not be fully explained by the organic aerosol related production (see Figure 1). They speculated the existence of a missing gas‐phase organic carbon source in the remote troposphere on the order of 0.1–0.7 ppb C/day, the origin of which is yet to be determined. Alma Hodzic (ACOM) and co-authors used ATom aerosol data to evaluate the ability of eight global chemistry models in simulating organic aerosols (OA) in the remote free troposphere where previous modeling studies reported up to three orders of magnitude spread in their predictions (Hodzic et al., 2019). The current model ensemble was able to capture the average vertical and spatial distribution of measured OA concentrations, however this improved agreement with observations occurred for the wrong reasons, as models greatly overestimated the primary OA fraction, and underestimated the chemical produced secondary OA. Measurements also indicated that OA in the remote free troposphere is 30-60% more oxygenated than in current models, which can lead to large errors in model estimates of global OA mass or its radiative forcing on climate. Samuel Hall and co-authors built a statistical tool to evaluate the effect of clouds on photolysis rates over the remote Pacific and Atlantic Oceans and their representation in nine global models (Hall et al., 2019). Representing clouds in global models is extremely challenging as clouds vary in phase, form at different altitudes, overlap, and their features are often small compared to model pixels (50-200 km). Clouds can shade or reflect radiation depending on the relative location of the sun and this drives chemical reactions. The study found that the range of modeled cloud effects is inconsistent but fell into two basic groups. The first group showed nearly clear-sky most of the time, due in part to the treatment of cloud fractions when averaging over large model grid cells. The second group was more influenced by clouds and generally similar to the measurements with enhanced photolysis rates aloft and/or diminished at the surface.
References
Asher, E., et al. (2019). Using airborne observations to improve estimates of short-lived halocarbon emissions during summer from Southern Ocean, Atmos. Chem. Phys. Discuss., https://doi.org/10.5194/acp-2019-102, accepted/in preprint.
Hall, S. R., et al., (2018). Cloud impacts on photochemistry: building a climatology of photolysis rates from the Atmospheric Tomography mission, Atmos. Chem. Phys., 18, 16 809–16 828. https://doi.org/10.5194/acp-18-16809-2018
Hodzic, A., et al. (2019). Characterization of Organic Aerosol across the Global Remote Troposphere: A comparison of ATom measurements and global chemistry models, Atmos. Chem. Phys. Discuss., https://doi.org/10.5194/acp-2019-773, in review.
Murphy, D. M., Froyd, K. D., Apel, E., Blake, D., et al., (2018). An aerosol particle containing enriched uranium encountered in the remote upper troposphere, Journal of Environmental Radioactivity, 184-185, 95-100. https://doi.org/10.1016/j.jenvrad.2018.01.006
Schill, G., et al., The ubiquity of dilute, aged smoke in the global remote troposphere and its effect on climate, submitted to Nature Geoscience, 2019.
Wang, S., Hornbrook, R. S., Hills, A., Emmons, L. K., Tilmes, S., Lamarque, J.‐F., et al. (2019). Atmospheric acetaldehyde: Importance of air‐sea exchange and a missing source in the remote troposphere. Geophysical Research Letters, 46. https://doi.org/10.1029/2019GL082034
Contact
Please direct questions/comments about this page to:
Carl Drews
NSF NCAR | Research IT | ACOM