1H: The Tropical Tropopause Definitions Revisited Using Airborne In Situ Trace Gas Measurements
Discovered more than a century ago, the tropopause is known to mark the boundary of two dynamically and chemically distinct layers of atmosphere, the stratosphere and the troposphere. In the tropics, the location, temperature, and physical/chemical gradients of the tropopause are important as part of the fundamental knowledge of the atmosphere and for regulating the amount of water vapor entering the stratosphere, which has a significant contribution to climate forcing. The tropopause over the tropical western Pacific, in particular, is known as the “decisive region” for determining the amount of stratospheric water vapor. High-resolution measurements for this region are rare because the region is remote and tropopause altitudes are difficult to access. An airborne experiment targeting this decisive region was conducted in 2014, using the NASA Global Hawk unmanned aircraft system. These high-resolution temperature and trace gas data provided an unprecedented opportunity to examine the physical meaning of the two tropical tropopause definitions, known as the lapse-rate tropopause (LRT) and the cold-point tropopause (CPT).
In collaboration with NASA and NOAA colleagues, NCAR ACOM scientists have conducted a data analysis using the in situ measurements from the Global Hawk to examine the differences produced by these two commonly used definitions. This work, published in Geophysical Research Letter, demonstrated that the relationship of two chemical tracers, ozone and water vapor, can unambiguously identify the transition from troposphere to stratosphere and therefore serve to diagnose the effectiveness of the different tropopause definitions. The combined temperature and trace gas analysis shows that the lapse rate definition better identifies the transition from the troposphere to the stratosphere (Pan et al., 2018).
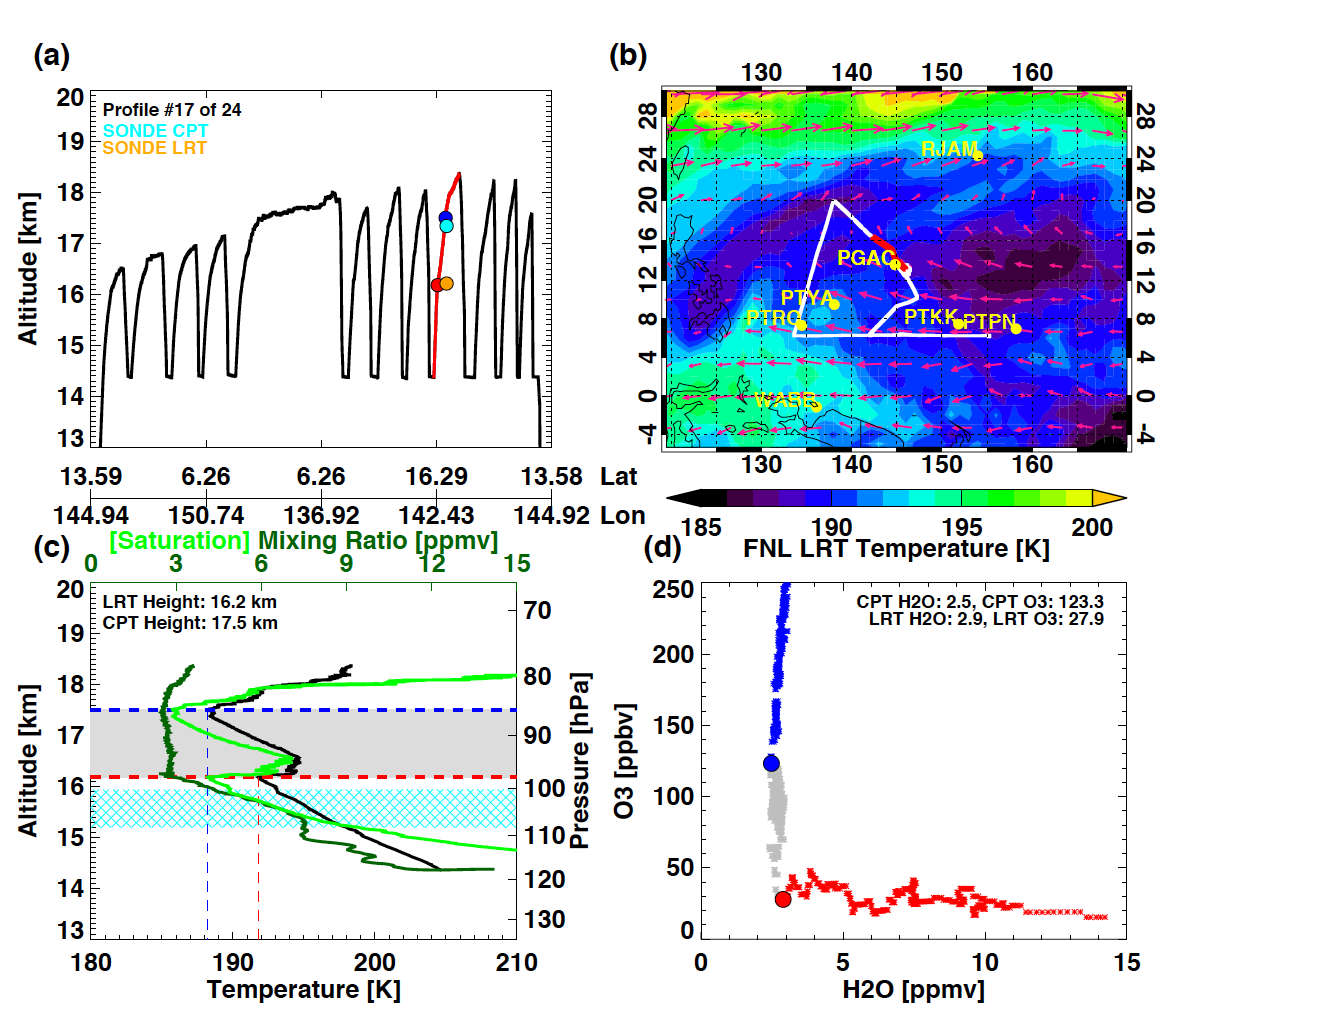
In the upper troposphere and lower stratosphere, H2O and O3 exhibit a demonstrated “L”-shaped relationship in the tracer-tracer space (Pan et al., 2007; Hegglin et al., 2009; Pan et al., 2014). Specifically, the compact relationship in the O3-H2O space shows the tropospheric data as a branch with a large range of water vapor variation and a relatively narrow range of ozone variation, while the lower stratospheric data appear as a branch of large ozone variation and a relatively narrow range of water vapor. The change between the two branches marks the transition in dynamics and chemistry, i.e. from the vertical mixing dominated troposphere where water vapor is abundant to the horizontal mixing dominated stratosphere where ozone has its major source.
Figure 1 shows an example vertical profile from the flight on 6 March 2014 where the CPT and LRT are both clearly identifiable in the temperature profile and show a large separation (>1 km). The “L”-shaped O3-H2O relationship clearly indicates that the LRT marks a sharp change from the troposphere to the stratosphere. The analysis using all the in situ measurement profiles over the tropical western Pacific has led to a conclusion that LRT as a better tropical tropopause definition is a statistically consistent result.
An important take home message from this work is that although the separation of LRT and CPT is small on average in this deep tropical region, the different roles of these two levels revealed by tracers indicate that the two levels are controlled by different processes. Overall, the result of this analysis not only verified which definition is marking the boundary between the two layers, but also provided additional insights into the physical and chemical processes controlling this fundamental atmospheric structure.
Publication:
Pan L. L., Honomichl, S. B., Bui, T. V., Thornberry, T., Rollins, A., Hintsa, E., & Jensen, E. J. (2018). Lapse rate or cold point: The tropical tropopause identified by in situ trace gas measurements. Geophysical Research Letters, 45, 10,756–10,763. https://doi.org/10.1029/2018GL079573
Additional References:
Pan, L. L., et al. (2007), Chemical behavior of the tropopause observed during the Stratosphere-Troposphere Analyses of Regional Transport experiment, J. Geophys. Res., 112, D18110, doi:10.1029/2007JD008645.
Hegglin, M. I., C. D. Boone, G. L. Manney, and K. A. Walker (2009), A global view of the extratropical tropopause transition layer from Atmospheric Chemistry Experiment Fourier Transform Spectrometer O3, H2O, and CO, J. Geophys. Res., 114, D00B11, doi:10.1029/2008JD009984.
Pan, L. L., L. C. Paulik, S. B. Honomichl, L. A. Munchak, J. Bian, H. B. Selkirk, and H. Vömel (2014), Identification of the tropical tropopause transition layer using the ozone-water vapor relationship, J. Geophys. Res. Atmos., 119, doi:10.1002/2013JD020558.
Contact
Please direct questions/comments about this page to:
Carl Drews
NSF NCAR | Research IT | ACOM