COVID-19 impact on Asian emissions: Insight from space observations
Authors: Helen Worden, Sara Martínez-Alonso, Mijeong Park, and Laura Pan
Published: March 26, 2020
On March 17th, the lead PIs of ACCLIP (Asian summer monsoon Chemical and Climate Impact Project) made the decision to postpone the ACCLIP airborne field campaign from summer 2020 to 2021. The airborne field campaign was jointly funded by the NSF and NASA, and involves both the NCAR research aircraft Gulfstream V and the NASA research aircraft WB-57. This decision was forced by the global COVID-19 outbreaks. During the decision making process, ACOM scientists looked into the perturbation to atmospheric composition due to the large scale curtailing of human activities in response to COVID-19, in addition to the operational issues. In this short briefing, we report on the large signature in atmospheric composition from spaceborne observations for the time period of lockdown in China during February to early March, 2020.
The COVID-19 outbreak is forcing large changes in global economical activities, including industries and transportation, and in people’s daily life in terms of work, school, shopping, and recreation. The large scale lockdown in China early in the year has resulted in significant decreases in atmospheric pollution, captured by multiple satellite observations. These observations highlight the significant role that human activities are playing in modifying our environment, and also provide an opportunity to understand, verify, and quantify the impact of various activities.
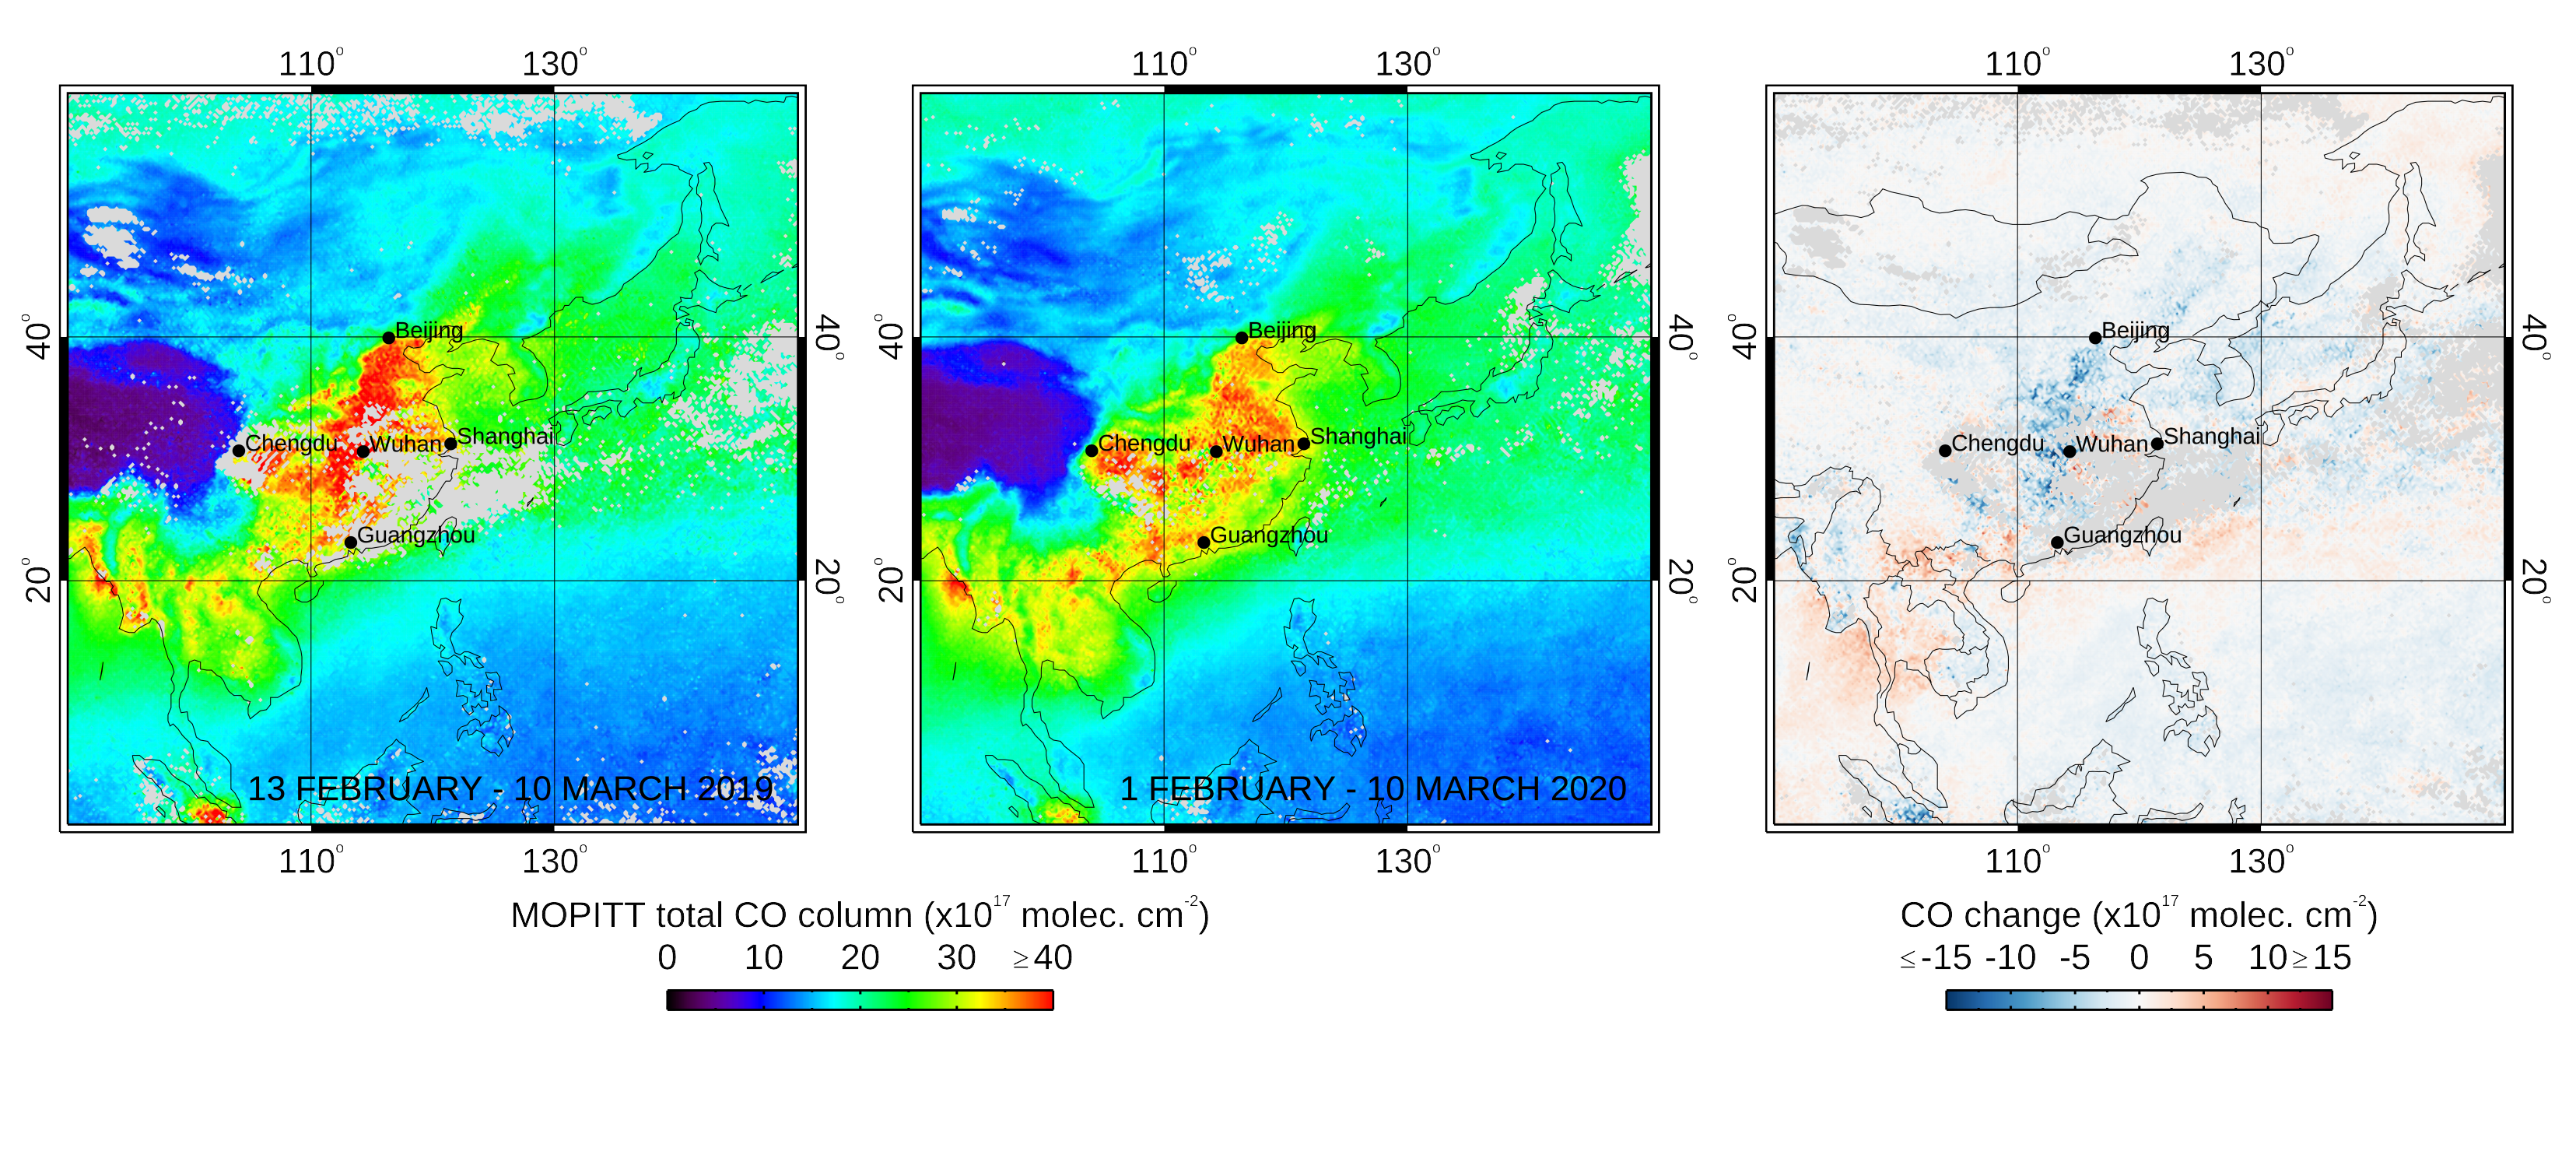
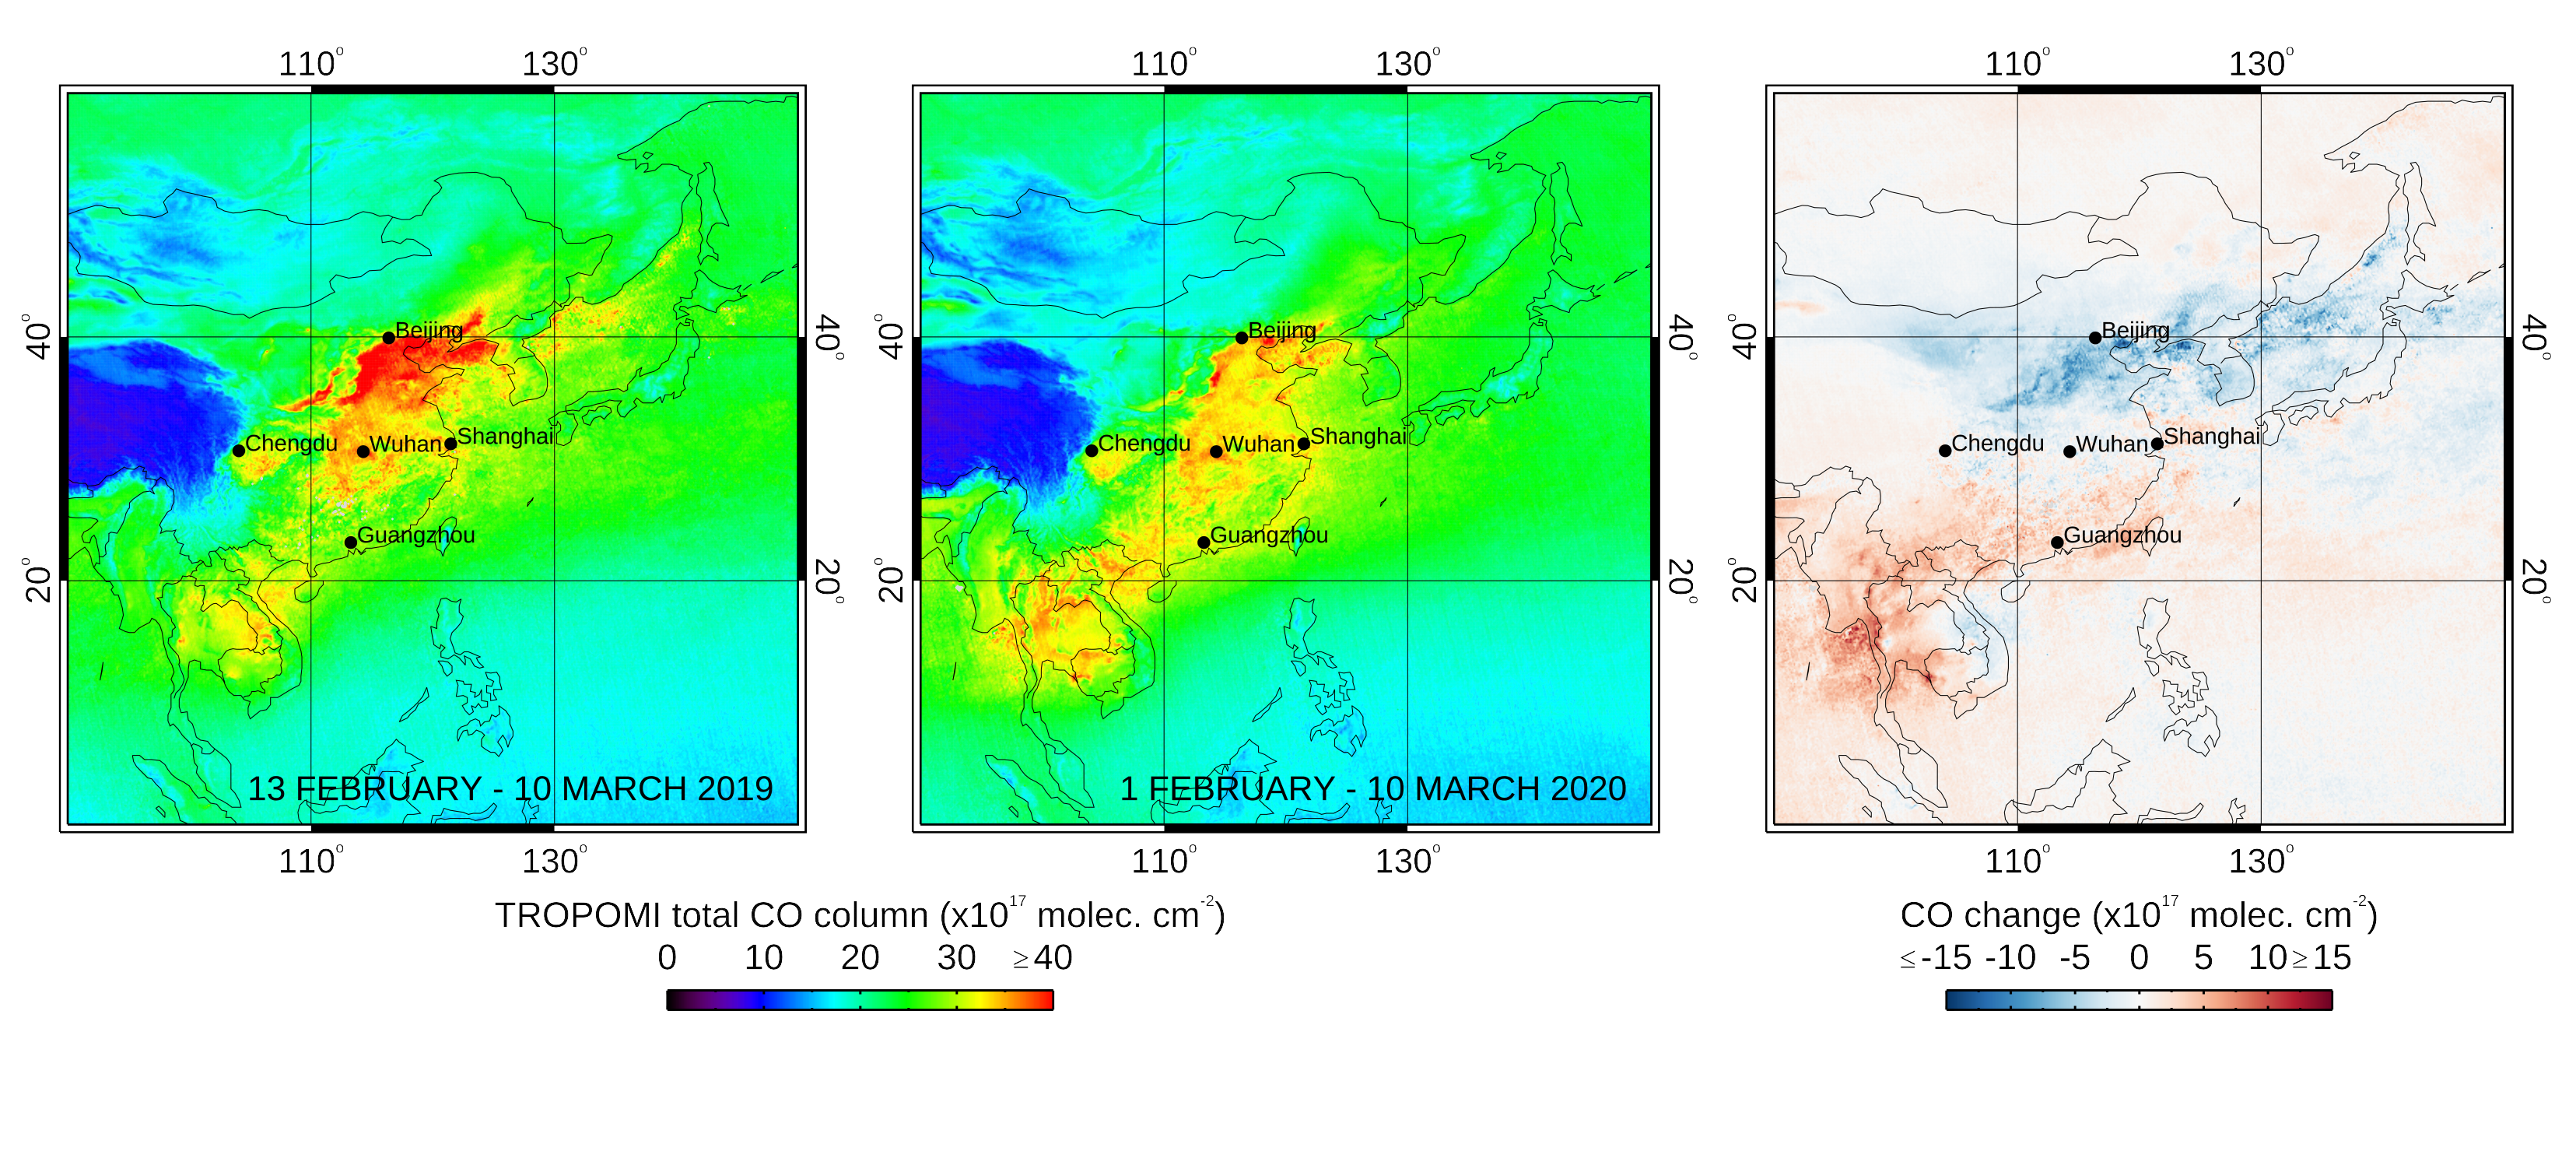
ACOM scientists have monitored the changes in tropospheric carbon monoxide (CO) over eastern China using NASA Terra/MOPITT and ESA S5P/TROPOMI data. The changes between the early lockdown period (1 February to 10 March 2020) and the equivalent period in the 2019 season are consistently quantified by the two datasets (Figures 1 and 2). We find approximately 30 to 45% peak reductions in CO comparing the post Chinese New Year (CNY) periods in 2020 to 2019.

Figure 1. (Left) Map showing MOPITT total tropospheric CO column values, averaged for the period following the 2019 Chinese New Year (CNY) holiday (4-10 February). (Center) Same for the period following the 2020 CNY holiday (24-30 January), during the lockdown. (Right) Change in CO between the two periods (2020 minus 2019). Initial results indicate that CO in the Beijing-Chengdu-Shanghai-Wuhan area has decreased on average by almost 6%, with more than 46% reduction locally. CO increase over SE Asia is consistent with seasonal fires, also observed by the MODIS instruments. Gray indicates missing values due to clouds. © 2020 UCAR. This image is freely available for media & nonprofit use. Click for larger image.

Figure 2. (Left) TROPOMI total tropospheric CO column values in 2019, following the CNY holiday. (Center) Same for the period following the 2020 CNY holiday, during the lockdown. (Right) Change in CO between the two periods. On average, CO in the Beijing-Chengdu-Shanghai-Wuhan area has decreased by close to 9%, with up to 33% reduction locally. See caption for Figure 1 for details. © 2020 UCAR. This image is freely available for media & nonprofit use. Click for larger image.
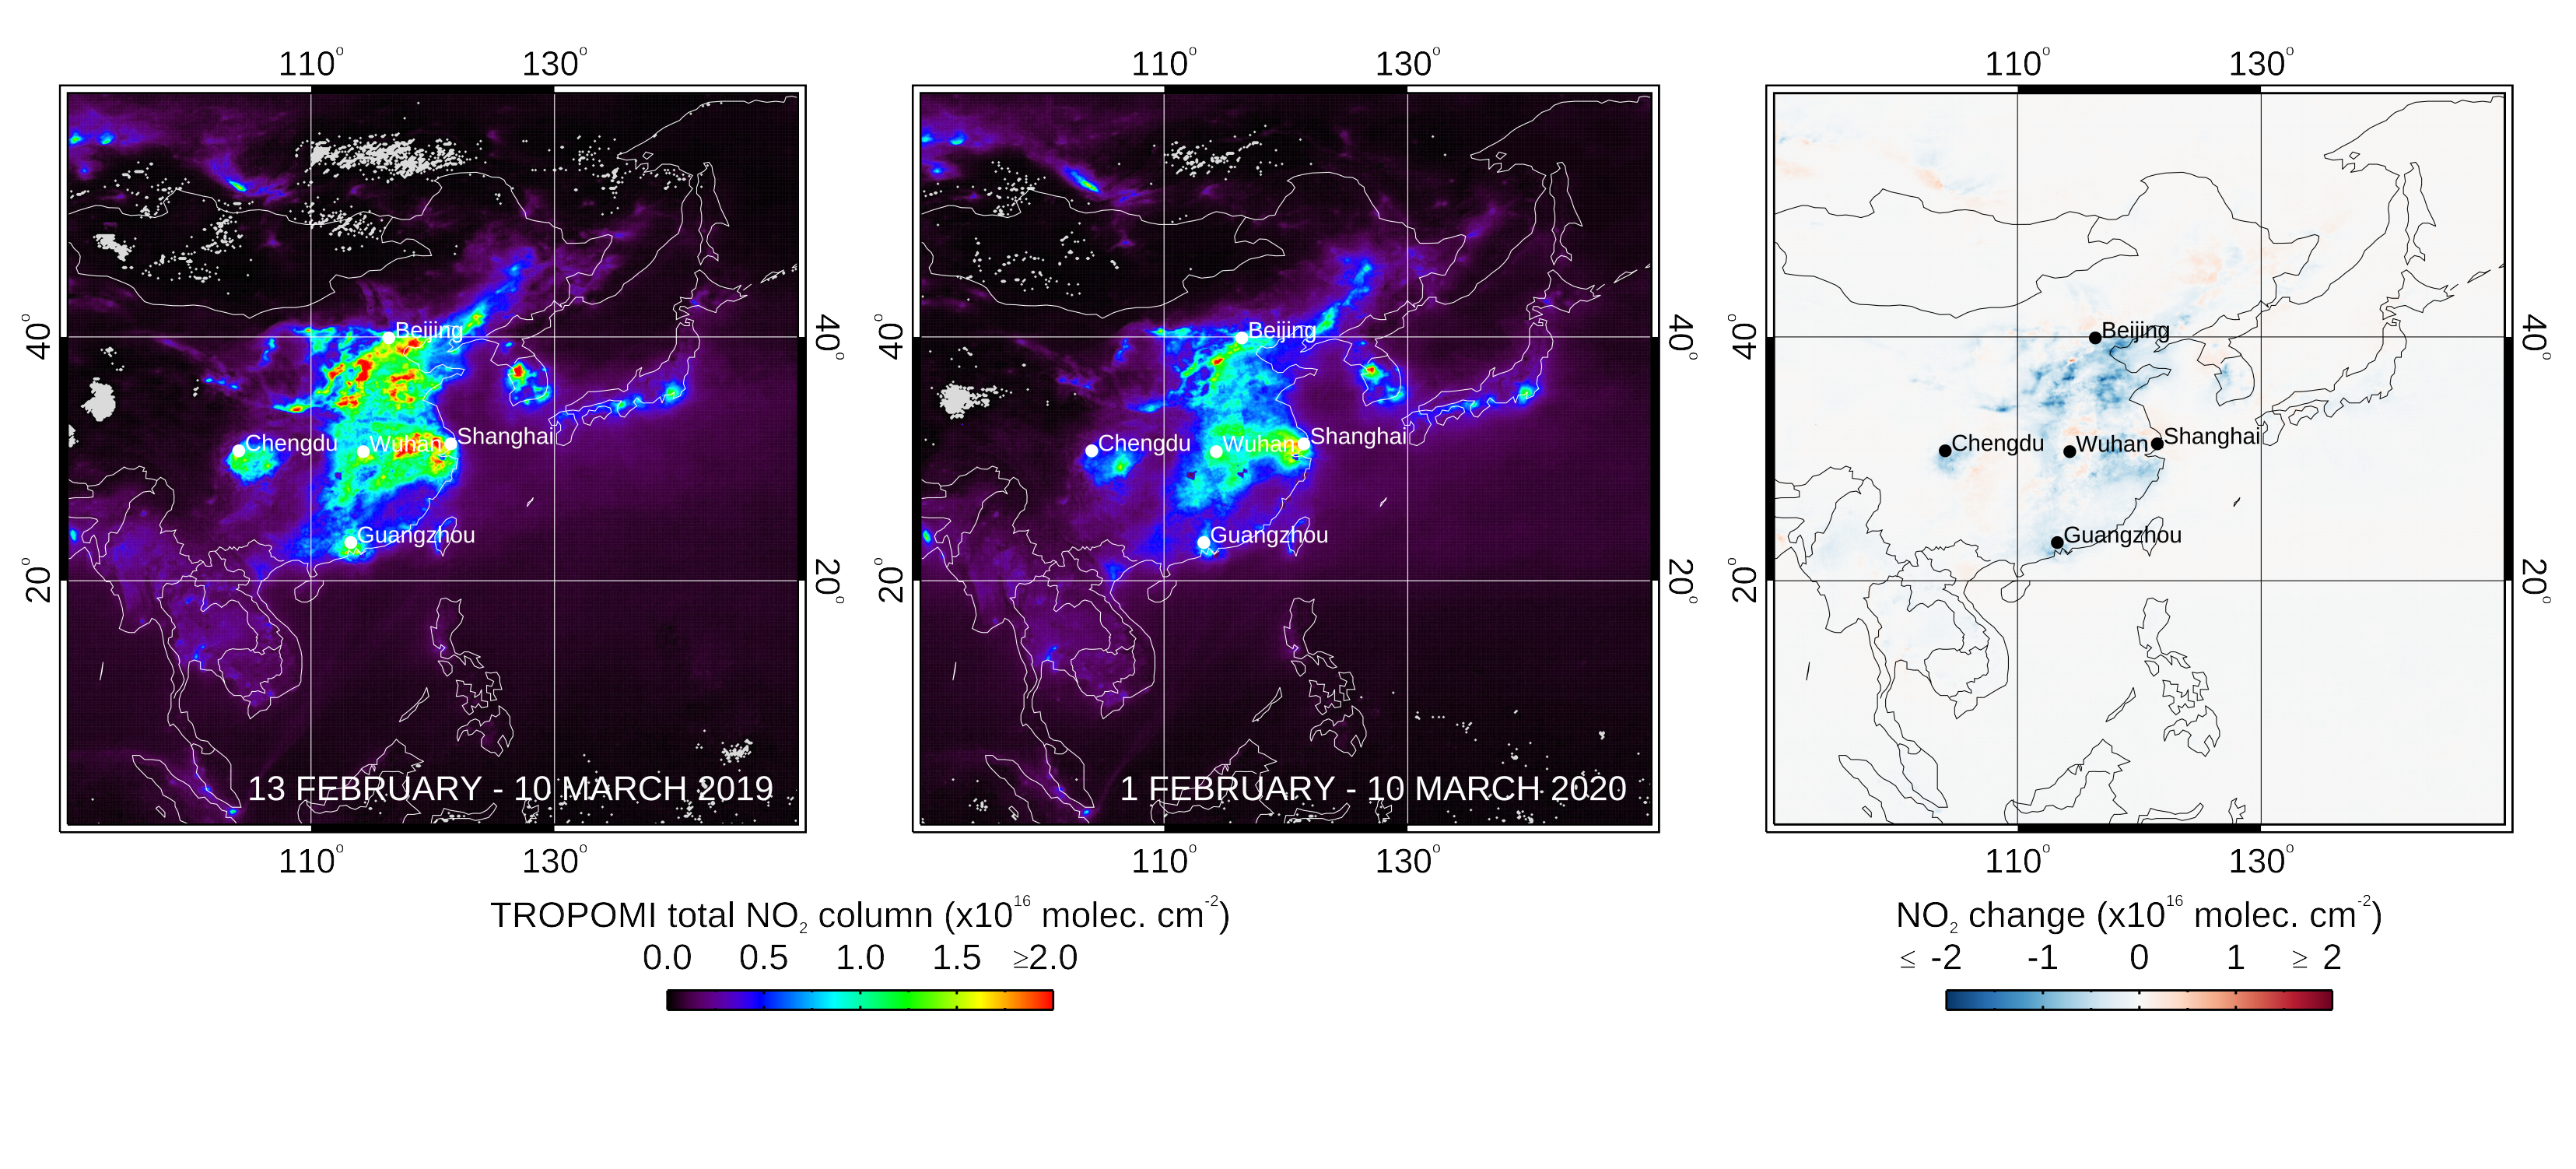
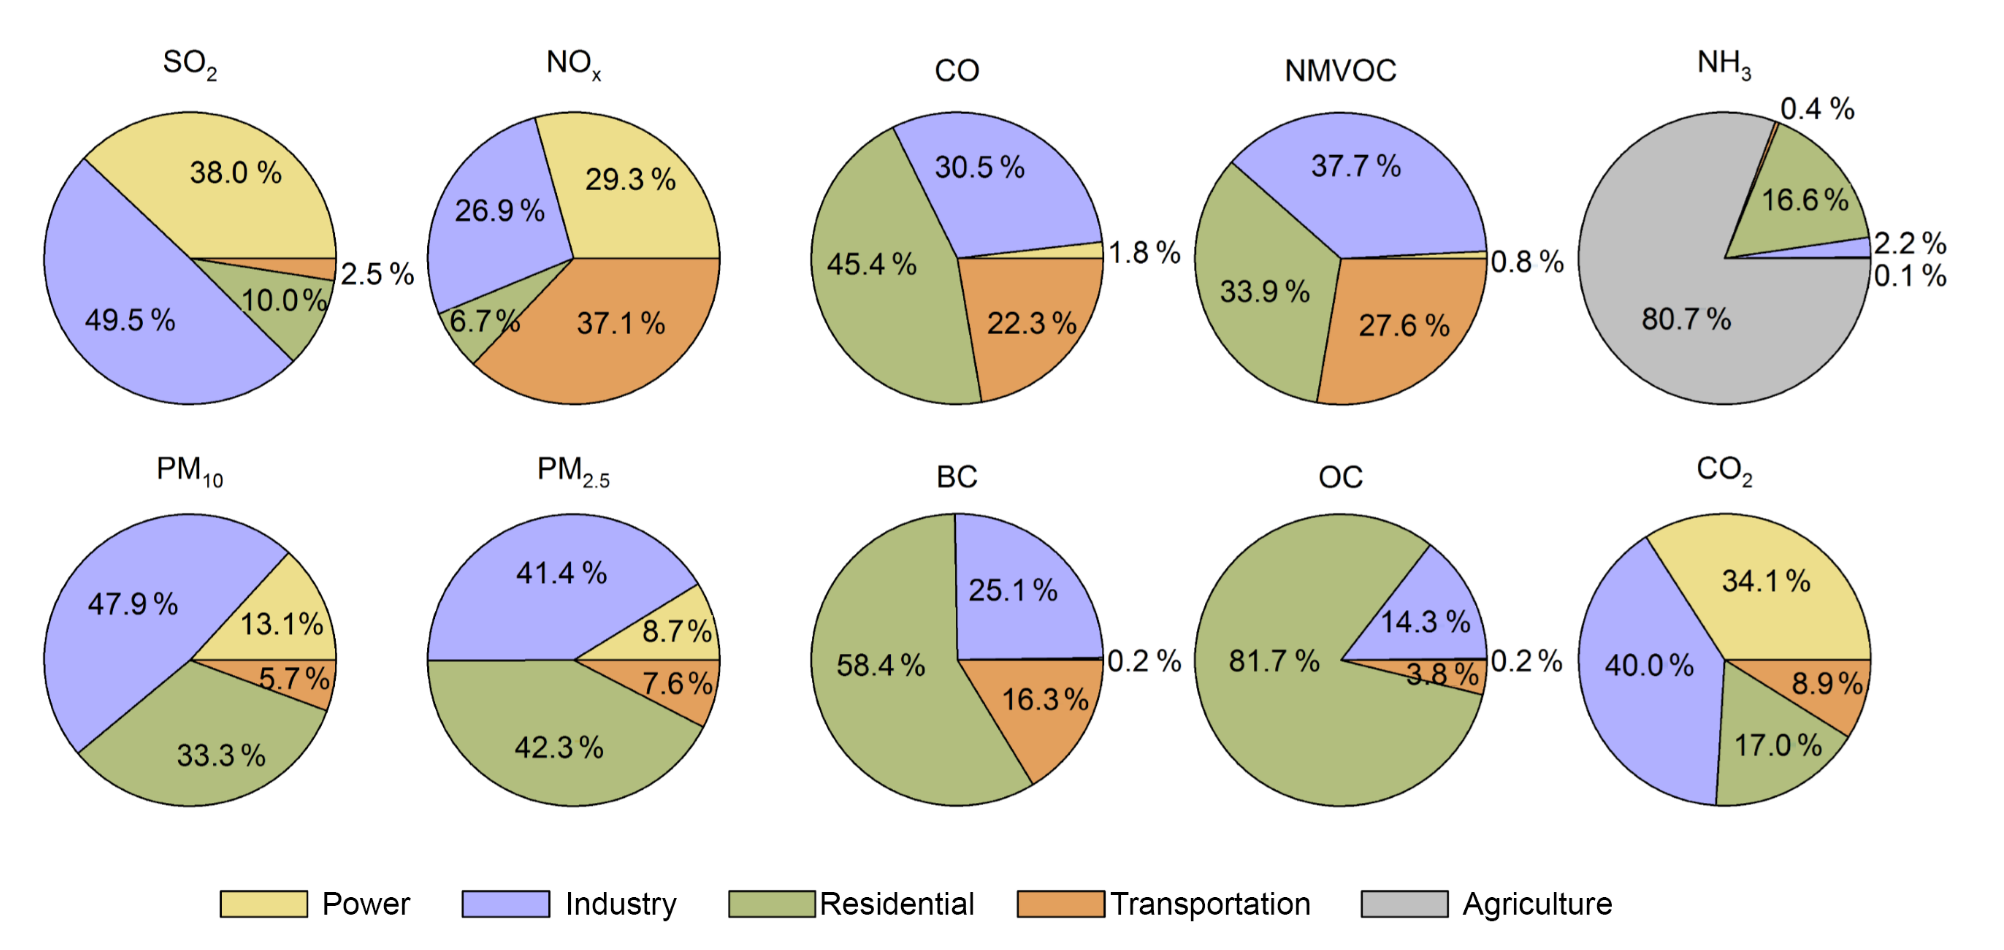
Significant changes are also observed in NO2, as reported by several articles (see for example The New York Times: "Traffic and Pollution Plummet as U.S. Cities Shut Down for Coronavirus"). Figure 3 shows the large changes over Eastern China. We find approximately 70% peak reductions in NO2 comparing the post Chinese New Year (CNY) periods in 2020 to 2019. The much wider extent and magnitude of the decrease in NO2 compared to CO reflects the different sources and lifetimes of the two pollutants. CO lifetime is a few months in winter, so measurements include contributions from globally transported CO. NO2 lifetime is hours to days, so observations show local emission sources much more directly than CO. There are also differences in emission sources for CO and NO2. We would expect the industry and transportation sectors to be most affected by the lockdown and both have CO and NO2 emissions. However, the largest source of CO in Asia is the residential sector, which would likely not have reductions due to the lockdown (see Figure 4). These similarities and differences in the changes of the two pollutants provide a research opportunity for quantifying their sources.

Figure 3. (Left) TROPOMI total tropospheric NO2 column values in 2019, following the CNY holiday. (Center) Same for the period following the 2020 CNY holiday, during the lockdown. (Right) Change in NO2 between the two periods. NO2 in the Beijing-Chengdu-Shanghai-Wuhan area has decreased on average by more than 27%, with up to 71% reduction locally. See caption for Figure 1 for details. © 2020 UCAR. This image is freely available for media & nonprofit use. Click for larger image.

Figure 4. Emission distributions for different sectors in Asia, 2010. NOx and CO both have significant emissions from the industry and transportation sectors. (Figure from Li, et al., ACP, 2017.) Click for larger image.
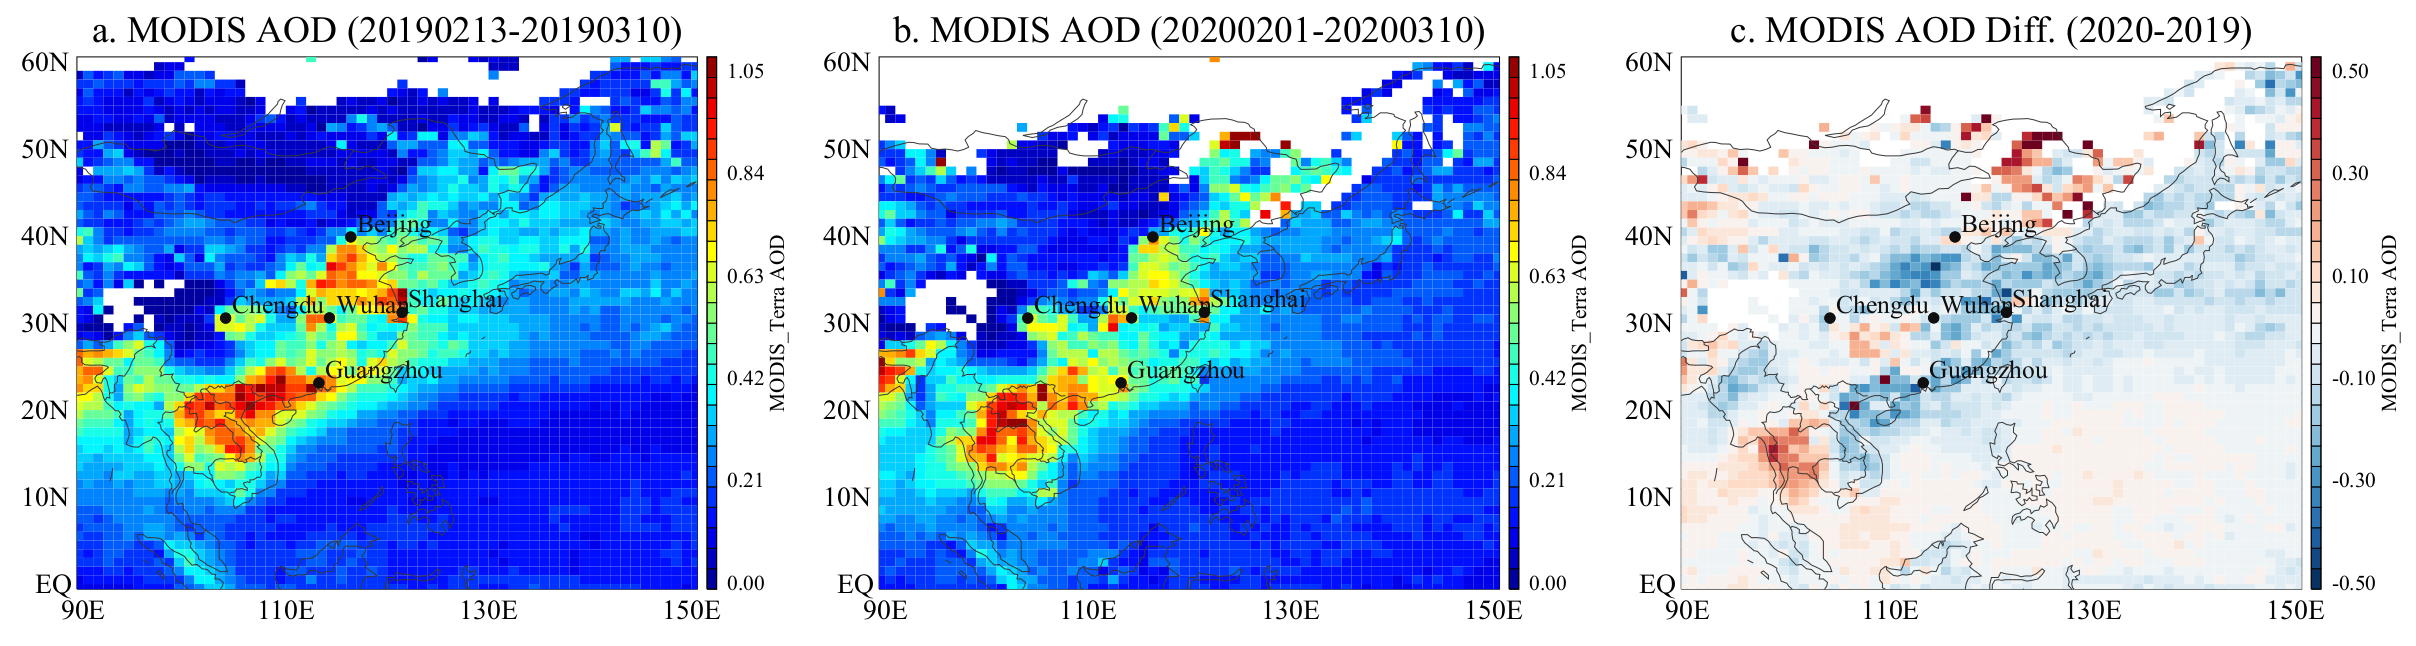
The reduced emissions had a significant impact on the air quality, reflected in the large decrease of aerosol optical depth (AOD), shown in Figure 5, which includes both PM10 and PM2.5. Satellite observations of AOD are an indication of aerosol pollution, but do not have information about the vertical level and more information would be needed to assess the improvement in air quality at the surface.

Figure 5. Maps of Aerosol Optical Depth (AOD) over China in (a) 2019 (Feb. 13- Mar. 10), (b) 2020 (Feb. 1- Mar. 10) and (c) differences between those two periods [unit: none] based on daily observations from the Moderate Resolution Imaging Spectroradiometer (MODIS) on board the Terra spacecraft. Significant reductions in AOD are observed in Northern China between Wuhan and Beijing due to reduced anthropogenic emissions. In contrast, a large increase is present in Southeast Asia including Thailand, as well as Northeast China, due to fire activity. © 2020 UCAR. This image is freely available for media & nonprofit use. Click for larger image.
These data provide insight into pollution emissions in China, and also how much human activities are modifying the atmosphere. However, to quantify changes in emitted pollution, careful quantitative analysis is needed to account for satellite sampling differences and annual variations in meteorology, including the effects of cloud coverage, and other pollution sources such as wildfires. This will involve using the observed concentrations with chemical transport models to infer changes in emissions. (See this article for a discussion on factors to be considered in interpreting satellite observations.)
As impacts from COVID-19 expand across the globe, we will continue to monitor consequent changes in atmospheric composition due to adjustments in human lifestyle and industrial activities. We also need to monitor changes due to economic recovery as industrial and transportation activities increase again.
Reference:
Li, M. Zhang, Q., Kurokawa, J.-I., Woo, J.-H., He, K., Lu, Z., Ohara, T., Song, Y., Streets, D. G., Carmichael, G. R., Cheng, Y., Hong, C., Huo, H., Jiang, X., Kang, S., Liu, F., Su, H., and Zheng, B.: MIX: a mosaic Asian anthropogenic emission inventory under the international collaboration framework of the MICS-Asia and HTAP, Atmos. Chem. Phys., 17, 935–963, https://doi.org/10.5194/acp-17-935-2017, 2017.